


Margin Call: Fermi Problems, Highway Horrors, Black Swans, and Why You Should Worry About When You Should Worry
“Reports that say that something hasn’t happened are always interesting to me, because as we know, there are known knowns; there are things we know that we know. There are known unknowns; that is to say, there are things that we now know we don’t know. But there are also unknown unknowns — there are things we do not know we don’t know.”
— Donald Rumsfeld, February 2002
Today’s topic is engineering margin.
XKCD had a what-if column involving Fermi estimation, also known as a Fermi problem, where you answer questions like how many shoes you can make out of a cow hide, or how many piano tuners are in Chicago, or how much wood could a woodchuck chuck if a woodchuck could chuck wood, just by making estimates based on first principles, reasonable assumptions, and facts that are easy to look up. In a Fermi problem, you’re not trying to get a perfect answer, you’re just trying to be right within, say, a factor of 5 or 10.
It gave me an idea for an article. At first, I was going to do something similar, in an electronics context. (Never did get around to actually thinking of a good one, though. Most elegant attempt: how many 10KΩ resistors does Digi-Key sell in a year?) But then I ran across some other issues, and things got a little darker. From time to time I get angry when I read things on Reddit or StackOverflow, because in some cases it makes me think about misplaced priorities, or stupid stumbling blocks in software development that just shouldn’t be there.
Anyway, let’s just leave the darker stuff for later.
The main point I want to make is that there’s a corollary to Fermi problems, and that is, what are you going to do with the answer? Yeah, great, there are about 125 piano tuners in Chicago. So what?
Hurried Highway Horrors
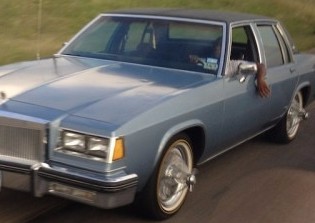
Let me give you an example. Suppose you’re driving in a car on some US highway at 65 miles an hour (that’s about 105 km/hr for those of you living in countries with sane unit systems) and there’s another car coming up fast behind you in a neighboring lane. You suddenly notice that the wheels have what looks like a cone of sharp steel knives protruding from the hubcap, spinning round and round. The sight is fascinating and draws your attention… the car is right near the edge of its lane, and the whirring blades seem to line up right with the lane markings, so that the tip of these hubcaps from hell are just barely sticking over into your lane. How much distance is there between this car and your car? Is this too close? Should you move away?
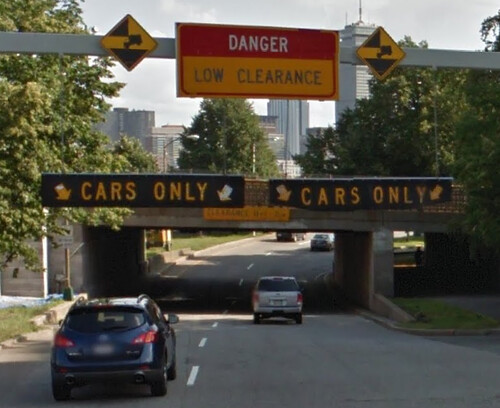
Here’s another example: you’re a truck driver in one of those European countries with a sane unit system. You’re making a delivery to someplace new, but it’s no problem, you have a GPS receiver, one of those ones with the talking voice, which you set yesterday to your liking, and then named it Svetlana. Look, there’s an overpass coming up. It has a sign that says 13’ 0”. Oh no! Some hooligan has switched out the overhead clearance sign from metric to American! The truck needs 3.95m clearance. Is it safe to drive underneath? Quick — answer!
These are both contrived situations, but in reality we deal with this sort of thing almost every hour of every day. Life is full of sensory and information overload, and we all have to be our own personal air traffic controller, deciding which of those bits of information we can ignore (most of them) and which we have to pay a little attention (the strange guy in a hoodie jacket nearby) and which we have to stop and deal with right now (that car that’s veering into our lane on the highway, or the upcoming overpass that we may not be able to fit under).
They are also two entirely different problems. In the first case, at first it’s not obvious what number to use; if you did have to come up with a number, you’d have to stop and think and estimate. In the second case, you have the number, but you have to translate it into something you can use before you decide.
In both cases we’ve got a very abrupt change from a safe to an unsafe situation. Physics doesn’t care about engineering margin.
How might we deal with these problems?
Problem 1: Car with crazy wheels
Okay, in the first case, that other car with the crazy wheels is at the edge of its lane. The standard for lane widths on US Interstate Highways is a minimum of 3.6m (just under 12 feet). The standard for the width of lane markings is 10-15 cm (4-6 inches), which means that the distance from the center of your lane to the lane markings could be as small as 1.73m (= half of 3.6m - 15cm). If you were driving a large commercial vehicle in the center of your lane, its maximum width is 2.6m, so that takes 1.3m from the centerline. That still leaves 43 cm of room for you to stay in the center of your lane. But in this case you’re driving a car; most passenger cars appear to be 1.7m - 1.9m in width not including mirrors, 1.9m - 2.1m including mirrors, so even if your car is 2.1m wide including mirrors, and you drive in the center, that’s 1.05m from centerline, and you have a whole 68cm of room to stay in the center of your lane. Hmm. 68 centimeters. Now, how much variation in car position do you usually exhibit when you’re driving on the highway?
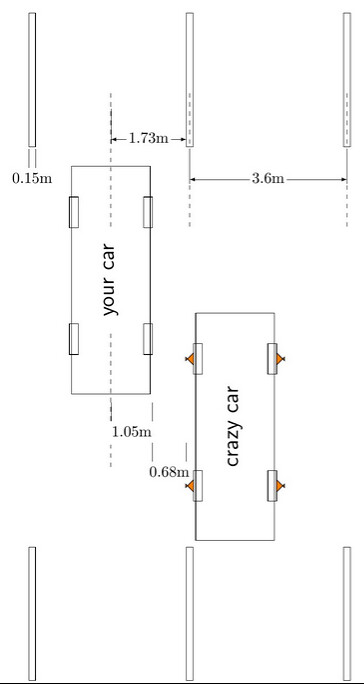
More likely though, you won’t be doing that kind of math; instead you’ll move towards the other edge of your lane to avoid it, because it’s a car with crazy wheels, and the driver might be crazy too.
Problem 2: Truck under badly-signed overpass
Aside from quantum effects, your truck is either going to hit the overpass, or it’s not. If you have an overpass with 3.96m minimum clearance, and you’re driving a truck that’s 3.95m high, you should be able to drive underneath it at full speed. That’s a whole centimeter of margin. (For the record, 13 feet is approximately 3.9624m, so that’s 1.24cm of margin.) Plenty of nitrogen and oxygen atoms there between the truck and the overpass.
Right?
Well… what about the truck bouncing up and down as it zooms down the highway? What if it tilts a little bit to the left or right? What about the air pressure in the tires? Do those tires change shape at 100 km/hr compared to 50 km/hr or at a standstill? How much weight is the truck carrying, and how does the truck’s suspension change shape depending on load? Is the overpass height measured at night, or during the day, where elevated temperatures cause the overpass to expand? If you want to get away with 1cm of margin, these are the things that you have to think about. Or maybe you have to slow down to a crawl so you don’t tempt fate or the consequences of an error. Now, if you had a truck that’s 3.75m high, you’ve got a lot more margin, and you can probably just keep on zooming along at highway speeds.
Design Margin for the Impatient
This article is a long one, so if you’ve got TL;DR running through your head right now, I’ll get to the point, and you can move on to some other webpage about Grumpy Cat or Donald Trump after this section.
- Design margin is additional allowance for uncertainty, added to (or subtracted from) some minimum (or maximum) required value.
- Keeping design margin low requires more work to understand whether that design margin is sufficient.
- Larger design margin allows you to make simple, quick decisions with confidence, instead of having to stop and work through all the gotchas and edge cases and second-order effects and unknowns.
There are certainly types of careers where dealing with design margin is a more common task than others (chemical engineers and civil engineers and nuclear engineers have pretty big problems if they’re wrong), but you will run into it in almost any technical job.
Here are some examples that are more realistic than the two highway horror cases I outlined earlier:
Electrical engineering
- You’ve got two 3.3V CMOS logic gates that are connected on two different circuit boards. You can only use 3 wires to connect the boards: two for a 3.3V power supply and its return conductor, the third for a logic signal. Board B gets its power from board A through the power supply. The wires are 28 gauge. How much current can you draw from Board B before the voltage drop across the power supply wires is large enough that you can’t guarantee that a logic low from Board B is received as a logic low on Board A?
- You’re designing a multidrop system using CAN at the full 1 megabit/second rate. You need to allocate data bandwidth, with most of it going for a datalogging application, but you need to leave some left over for other messages and to prevent data collision. How many bits per second can you use for your datalogging?
- You’re using an NPN power transistor as a switch (either it’s on, or it’s off, none of this PWM crap) to carry 5A of current. The guaranteed transistor current gain beta at nominal conditions is β = 20. How much base current do you use? (Answer: none — why the @#\$% are you using a bipolar transistor when you could be using a MOSFET or IGBT?)
Software engineering
- You’re designing a data structure to contain IDs of books, authors, and publishers, for a new online bookseller called Orinoco that’s going to be the next big thing. How many bits do you allocate for the IDs? Your boss comes by and says, “Hey, do we really need 32 bits for that field?” What’s your answer?
- You’re working on a GUI and you need to pick a timer interval to run some display updates. You know that 1msec is too fast and you’ll swamp the UI queue. You also know that your customer wants the GUI to look instantaneous. How fast should the timer be?
- You’re a web developer, and your customer is the owner of a small kitchen appliance distribution company. He wants a new e-commerce website with Facebook and LinkedIn and Reddit and Instagram integration. Oh, and it should all be done in C++, because his nephew is learning that in college. How soon can you get him up and running? If you give an estimate that is too long, he’ll go find someone else; if you give an estimate that is too short, he’ll hire you, but you’ll end up working 60 hour weeks to get it done. What will you tell him? (Answer: five years from now, as long as the C++ requirement stands.)
Mechanical engineering
- You’re designing an aluminum flagpole meant to be mounted at a 45° angle to fly a 0.91m × 1.52m (3’ × 5’) flag at wind gusts up to 100km/hr. What’s the minimum amount of material you need to use so the flagpole doesn’t bend and break? (There’s actually a design guide to solve problems like this!)
- You’re designing plastic bottles for a cranberry juice manufacturer, who has complained that while your 0.2mm thick bottles are amazingly strong and lightweight, sometimes they bulge during the hot-bottling process. Your contacts there have promised that the maximum liquid temperature is 89°C, but you think they may not have such a tight control of liquid temperature. What changes do you have to make to your design to keep the bottles from deforming?
- You’re adapting a geartrain design you got from a coworker. It’s being used in normal indoor conditions. You need to change it and make it industrial strength to last 20 years in the Himalayas, at 4500 meters elevation and temperatures that can swing down to -30°C. Oh, and they probably won’t be replacing the lubrication oil as often as they should. What kind of design changes do you need to make?
Finance
- You’re on vacation on a tropical island with your wife. You have 24 hours left before you leave to go home. She sees a street hawker selling coconut half-shells carved scrimshaw-style into curled-up sleeping cats and dogs. Price for you: only US\$40, cash only please. She’s fallen in love and wants two of them. You think you have about \$150 in your wallet, maybe another \$100 left in your suitcase in your hotel. Everyone here wants American dollars, cash, and you still need enough money to pay for a few meals, a tip for the hotel maid, and a taxi to the airport. Can you afford the carved coconut shells? (Answer: NO!)
- You’re the owner of the Pacely Procket company and have to decide on a selling price for your new line of professional-grade prockets. You want to make sure they’re affordable so they sell well, but for now you may be able to command a premium, since no one else has prockets like these. But later on the other procket manufacturers will probably come up with similar prockets. It’s a competitive industry. You want to beat the competition, but you also need to make sure there’s enough profit for you to stay in business, and plan for your competitive advantage to decrease over time. What should you price the premium pro prockets so you can profit prudently?
Design margin and fudge factors
These are hard questions! They can’t be answered in a few quick paragraphs, so if you’re a TL;DRer, you can leave now. The rest of this article is just a taste of some of the things you might run into when calculating design margin, and they get into things like thinking probabilistically and conservatively, and looking for the right evidence to support being confident. Design margin is really about quantifying common sense to understand the required uncertainty in any given situation.
First, let’s look at design margin from two points of view:
- With perfect knowledge, how do you figure out an appropriate design margin?
- In the real world, how do you figure out an appropriate design margin?
Same underlying question, but as we’ll see, there are totally different insights at work here.
While you’re thinking about those two issues, consider another question:
- What’s the difference between design margin and a fudge factor?
Let’s take the first question (design margin with perfect knowledge in hand) first.
Omniscient beings need design margin, too!
Okay, here’s another situation. You have an old creaky cast-iron boiler circa 1926 that heats your house with steam radiators. You’re worried about it rupturing after all these years, and you want to know if you should replace it. So you call in the Oracle. He’s a sharp guy with a huge head, a successful consulting business, a subscription to LexisNexis, 24/7 access to Wikipedia, licenses for Maple, Mathcad, Mathematica, MATLAB, and several other software packages that don’t start with M, and a few dozen low-paid minions who help him think, in return for a vain hope that they might learn something. He Knows All. And here’s what the Oracle does with your question. (*Disclaimer: I am neither an Oracle or a steam heating engineer, so the following rationale is not perfectly realistic.)
- Model the system. Whether or not your boiler ruptures depends on the steam pressure and the tensile strength of the boiler vessel. The steam pressure varies with time, and is the quantity of interest. The tensile strength of the boiler vessel is essentially fixed, and is the limit. The boiler ruptures if the quantity of interest exceeds the limit. Oh, but they already thought of this during its design, so there’s a pressure relief valve, and if the steam pressure exceeds the threshold of the valve, it will relieve any excess pressure. Normally the steam pressure’s supposed to be less than the relief valve threshold, and the relief valve threshold is supposed to be less than the boiler vessel’s tensile strength, so the relief valve will always kick in before the pressure vessel bursts, and anyway the relief valve isn’t supposed to go off anyway.
- Come up with some quantitative estimates that take uncertainty into account. The Oracle decides that on any given day, the maximum steam pressure during that day is a Gaussian distribution with mean value of 125 kPa (18 psi) and standard deviation of 10% of the mean. The Oracle also researches your 1926 boiler and decides that after aging effects, the pressure relief valve has a threshold that is a Gaussian distribution with 210 kPa mean and 15 kPa standard deviation, and the tensile strength of the boiler is also a Gaussian distribution with 260 kPa mean and 20kPa standard deviation. The Oracle knows these numbers exactly, because he’s the Oracle.
- Estimate an acceptable level of risk, based on the consequences. You’re going to be in your house for at least 10 years, and given the severity and inconvenience of a ruptured steam boiler, the Oracle decides that you should be willing to tolerate a 10-6 risk of the boiler bursting during that time period. That’s one in a million. (You have a 191 × 10-6 risk of being killed in a traffic accident in a single year, or just under 0.2% in a ten-year span. So one in a million is kinda conservative.)
- Calculate a probability of those consequences happening. The Oracle starts with the pressure relief valve and the boiler. That’s kind of important. If the pressure relief valve goes off and does its job before the boiler bursts, you have nothing to worry about, just maybe a bunch of steam in your basement if the valve’s threshold is too low.
Here’s a graph of those probability distributions. The first thing you should look for is the margin between the probability distributions.
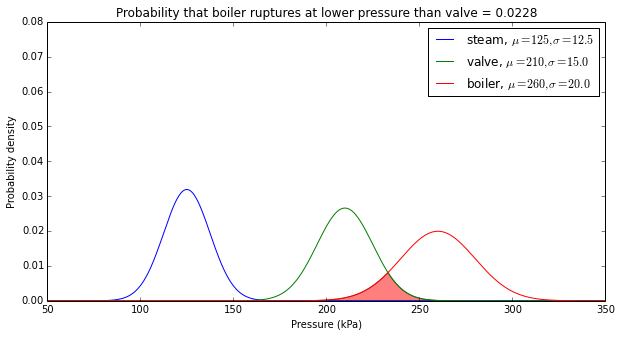
Okay, so let’s stop a moment. There’s quite a bit of overlap between the valve threshold and boiler rupture distributions, which means that there’s a small but significant chance (about 2.3%) that the boiler will rupture before the valve can protect it. The obvious conclusion here is that it’s time to get a new valve, which isn’t subject to all those aging effects and has a known threshold. The Oracle crunches some numbers (well, it’s just a Gaussian CDF after all; in Python you can just compute scipy.stats.norm.cdf(165,260,20) and get the answer yourself) and determines that there’s a 1.02 × 10⁻⁶ chance that the boiler will burst below 165 kPa, so that’s a good valve threshold to use. Get a 165kPa pressure relief valve and there’s only a one in a million chance that the boiler will rupture before the valve opens.
What happens if the boiler rupture level is below 165kPa? (This 1920s-era boiler is starting to become a headache just thinking about it.) Well, then the relief valve won’t save us. Now we have to look at the steam pressure. Our steam pressure distribution looks pretty good: the mean high pressure each day is only 125kPa. The standard deviation of 12.5kPa means that 165kPa is 3.2σ above the mean. We can run the numbers and determine that there’s a 99.9313% chance each day that the pressure will be below 165kPa.
But we wanted to plan on what happens over 10 years, or 3650 days. (99.9313%)3650 is only 8.14%. There’s a 91.8% chance that at least once during those 10 years, the pressure will hit 165 and the pressure relief valve will open to save us.
The Oracle pulls out his calculator, and figures out the chances of the boiler bursting in the next 10 years are about 1.6 × 10⁻⁸. (more precisely: the probability that the boiler rupture threshold is less than 165 kPa and during at least one day the maximum steam pressure is greater than the boiler rupture threshold) Without the pressure relief valve, the chances of the boiler bursting are 1.27 × 10⁻⁶. (Same calculation, but without the condition that the boiler rupture threshold is less than 165kPa.) So we’d probably be okay without the valve, but we’re much safer with it. The difference is that when there is no pressure relief valve, most of the chances of potential boiler rupture happen when the steam pressure is greater than 165kPa.
Design margin is necessary because of uncertainty in the behavior of system components.
Now, wait a minute — what did we need to know in order to get here?
- Exact probability distribution types of steam pressure, pressure relief valve, and boiler rupture strength (that is: Gaussian and not some other probability distribution)
- Exact parameters known for mean and standard deviation of all random variables
- No other unforeseen failure mechanisms were at work
In practice, these are unreasonable assumptions. The world is not an exact place. Nobody is going to be able to predict with certainty that your boiler has exactly a 99.9313% chance of being below 165kPa. The Oracle is an impossibility. Let’s call each of his predictions a “level 3” estimate — we’ll talk about lower level estimates, but the Oracle’s estimates require exact knowledge of probabilities, which are not achievable in practice.
How close to perfect can we get? Well, good process control can help, and in situations where there are a large number of samples to study, it’s possible to get fairly high confidence bounds on the probability distribution. Take earthquakes, for example.
Probability distributions and earthquake statistics
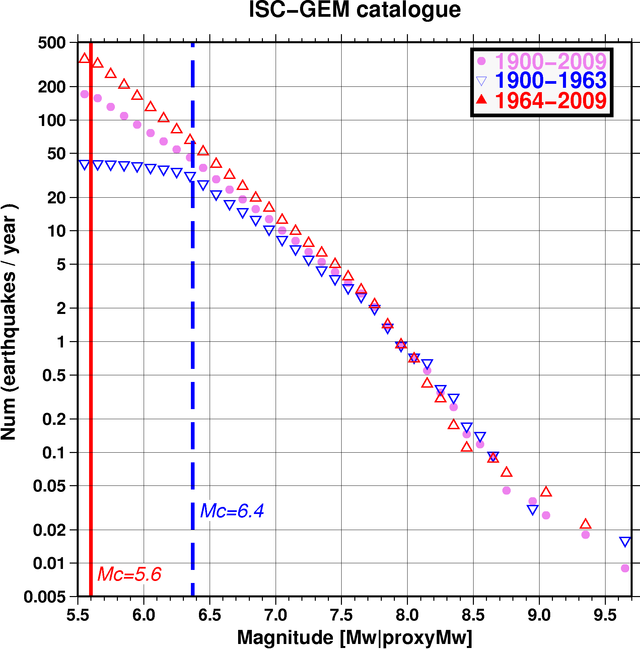
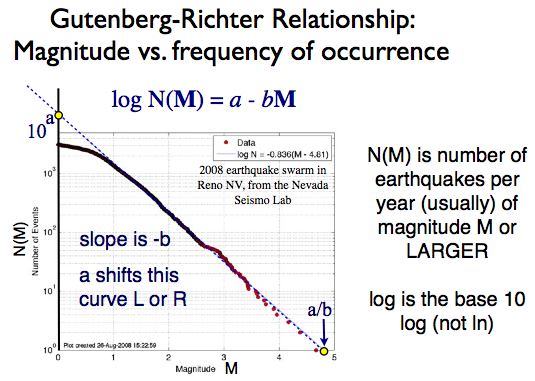
In the 1930s and 1940s, Beno Gutenberg and Charles Richter studied seismology at the California Institute of Technology. Richter published a paper in 1935 on a log-magnitude scale for measuring earthquakes, now widely known as the Richter scale. In 1944 Gutenberg and Richter published a paper on the relationship between the frequency and magnitude of earthquakes in California. Essentially, there is a linear relationship, now known as the Gutenberg-Richter law, between the magnitude and the log of frequency of earthquakes. A graph of this type showing worldwide earthquake data from the International Seismological Centre for the larger magnitudes looks like this:
The Gutenberg-Richter law appears to apply both locally and globally (with different parameters for different areas). Here is a graph of some data from Nevada in 2008.
And from the New Madrid area in Southeast Missouri:

In graphs of this type, the data usually fits very well to a line in the middle of the graph. The upper part of the graph sometimes shows a rolloff at lower magnitudes, often because at the time the data was available, instruments were not able to detect low-magnitude earthquakes reliably.
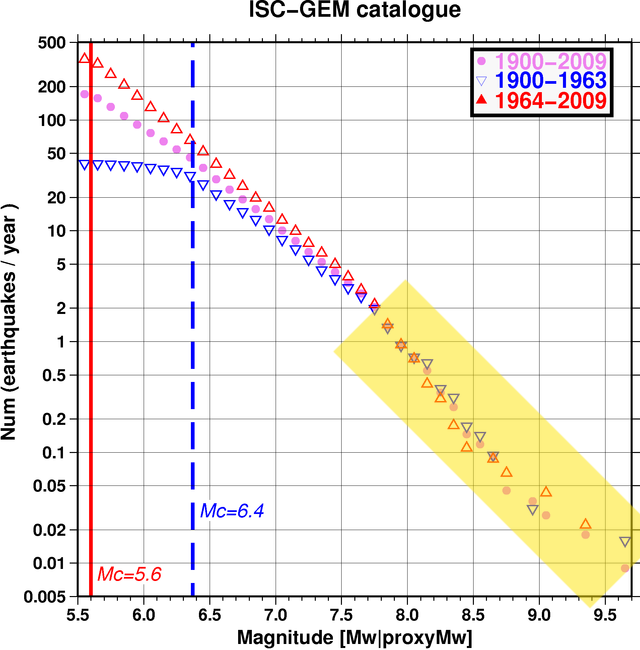
The lower part of the graph is more interesting. Here we run into a fundamental problem of characterizing data for low-frequency events: there aren’t enough samples! How can you say whether something happens once every few decades on average, if you only have data for a hundred years?
It’s like flipping coins: if you flip a coin 100 times, you can expect the number of heads to be somewhere near 50 times, but it might be 52 or 46. In fact the chances that you’ll get exactly 50 coin flips are only about 8%. (Coin flip experiments like this obey a binomial distribution, and you can check my math in this paragraph by using scipy.stats.binom.cdf in Python) There’s a 96.5% chance that you’ll get between 40 and 60 heads (40% - 60% of total coin flips, which I derived by running a=scipy.stats.binom.cdf([39,60],100,0.5); a[1]-a[0]) — but that means there’s still a 3.5% chance you’ll get less than 40 or more than 60 heads. If you do this experiment and you get heads 39 times, would you conclude that the coin is biased towards tails? Quite possibly. A good statistician wouldn’t, but it’s a low enough number to be suspicious.
On the other hand, if you have the patience to flip a coin 10,000 times, there’s a 95.5% chance that you’ll get between 4900 and 5100 heads (49% - 51%). We’d get a much tighter spread around the expected percentage of heads.
This is the flip side (no pun intended) of the Law of Large Numbers: In order to have high confidence that experimental data will match a theoretically known distribution, the number of samples has to be really large. And if you’re dealing with rare events, it means that a lot of time we don’t have enough data. In fact, that’s what the ISC webpage states:
We suspect that a pronounced dip in the magnitude frequency curve at large magnitudes reflects the fact that the 110 year period is still not representative enough to account for statistics of very large earthquakes.
So beware of making conclusions from small amounts of data. But wait, it gets even worse.

Black Swans and Murphy’s Law
Estimates of probability distribution, whether they are a Gaussian distribution, or a power-law distribution like the earthquake data, are practical to use because there’s some consistent mechanism at work. You don’t necessarily have to understand what that mechanism is, to model it empirically. For our boiler rupture problem, there are a number of processes at work, things like the manufacturing variation of metal (both thickness and alloy composition). So if it matches a Gaussian distribution for the majority of samples, that’s useful and that’s great.
Here’s the problem: just because the behavior of a system is dominated by one or two mechanisms, it doesn’t mean that there are other mechanisms lurking out there.
The statistician and ex-investment-manager Nassim Nicholas Taleb coined the phrase Black Swan event, as part of a theory that emphasizes that probability distributions that fit the normal behavior of a system are insufficient to model the extremes. (Black swans are a colloquial expression, referring to the general knowledge that all swans are white, and black swans are a well-known impossibility… at least until the Dutch discovered Cygnus atratus in Australia in the late 1600s.)
Back to our boiler problem for a second: Let’s say that you gave up on the Oracle’s certainty (remember, he doesn’t exist), but you like his general approach, and you have a huge amount of resources and time at your disposal. You locate and purchase 1,000 boilers of the same manufacturer, each made between 1921 and 1931. You hire the Mythbusters staff for the next 5 years, and measure the rupture strength of each and every one of your 1920’s-era boilers. You get data that’s a nice bell curve, and your Mythbusters staff advises you that the mean rupture strength is μ = 259.1 kPa ± 1.6kPa, with a standard deviation of σ = 19.5 kPa ± 1.2 kPa, because they’re smart statisticians and they know they’re not perfect and everything has errors, even the estimates of the errors themselves.
People often talk about “six sigma”, and in the context of a normal (Gaussian) probability distribution with fixed parameters, the probability of something being more than six standard deviations from the mean is only 1.97 × 10⁻⁹ — in other words, only one out of every 500 million samples fails to be within ±6σ. At that point we consider it essentially improbable, so your boiler’s going to burst somewhere between 140kPa and 380kPa, or maybe 138kPa and 392kPa… or something like that. You can be safe by getting a new steam pressure regulator and turning the steam pressure down to 135kPa. One in five hundred million! You’re more likely to win the next Powerball lottery.
Except....
Okay, remember, your cast-iron boiler was manufactured in the 1920s, before the McCarthy era, when many people dabbled in Communism and Socialism in the hopes of making a better life, and in 1926 a disgruntled Socialist iron worker sabotaged a batch of iron by contaminating it with sulfur, intending to hurt the company’s reputation by causing the iron to be weaker than normal. There’s a small chance this iron may have been used in your boiler. Maybe one out of every 50 boilers produced in 1926 by the same manufacturer have lower rupture strengths because of this act of sabotage.
Oh, and in 1955 a former owner of your house had a couple of car batteries stored in the basement next to the boiler, and in the process of moving them around, he spilled some battery acid on the bottom edge of the boiler, and didn’t do a good job cleaning it up. He was in a hurry, and fled to Argentina a few weeks later, leaving the bank to sell the house at a foreclosure sale later that year. Some of the battery acid’s still there though, and it’s been slowly eating away at the iron for the last fifty years. Will this make a difference in the rupture threshold of your boiler?
And by the way, you don’t know about either of these two issues. The first doesn’t show up in the data from the Mythbusters staff, at least not in any perceptible way, and the second is specific to your boiler only.
You are the victim of a Black Swan Event. Because once the normal statistical failures have been ruled out, all sorts of other risks come out of the woodwork to haunt you. Instead of only 2 out of a billion boilers lying outside the ±6σ range, there might be 200: 2 are the outliers predicted by the Gaussian distribution, and the other 198 are due to other unusual effects like the saboteur and the battery acid.
Taleb says this (and by the way, his book The Black Swan is a great read):
What we call here a Black Swan (and capitalize it) is an event with the following three attributes.
First, it is an outlier, as it lies outside the realm of regular expectations, because nothing in the past can convincingly point to its possibility. Second, it carries an extreme ‘impact’. Third, in spite of its outlier status, human nature makes us concoct explanations for its occurrence after the fact, making it explainable and predictable.
I stop and summarize the triplet: rarity, extreme ‘impact’, and retrospective (though not prospective) predictability. A small number of Black Swans explains almost everything in our world, from the success of ideas and religions, to the dynamics of historical events, to elements of our own personal lives.
So if you can’t know the probability distributions exactly in reality, and you can’t be certain that other improbable events aren’t going to happen from time to time, how do people deal with making sure things are safe?
Boiler Safety Factors in Practice
Mechanical engineers have been using safety factors for hundreds of years. The key is that you estimate the strength of your system, and add some extra engineering margin on top of it. If the boilers are designed with a rupture strength of 260kPa, you don’t rate them for use at 260kPa, you rate them for some lower value, like 1/4 of the rupture strength, or 65kPa, which gives you a safety factor of 4. What’s the justification for this? Well, it’s kind of a fudge factor. Or call it Black Swan Repellent. We’re just being extra-safe.
And the key to determining safety factors is that you don’t just pick a number. You pick a number and then do a whole bunch of experiments and analysis to feel good about that number. Yeah! Engineers like feeling good about things. We want confidence!
Walter Sperko has written a really interesting article about safety factors in boilers — you don’t even need to know anything about mechanical engineering to read it. It’s more historical. Here’s the summary:
- 1915: Safety factor was 5.0
- 1943: Safety factor decreased to 4.0 to conserve materials during the Second World War
- 1945: War is over! Safety factor restored to 5.0
- 1950: Huh, wait a minute, now we have two years of production with SF=4.0 — and they seem okay. Let’s analyze data from these boilers....
- 1951: Everything A-OK! Safety factor reduced to 4.0
- 1996: ASME Chairman of Subcommittee on Castings, Forgings, and Molded Parts: 4.0? Really? You guys are soooo skittish about these things. Can’t we get away with 3.5?
- 1999: Lots of new data, better process controls, etc! We’re good! Safety factor reduced to 3.5
Also, now the ASME Boiler Code doesn’t just state that there’s a safety factor of 3.5 — instead, boiler designers need to make sure all of these things are true:
- Pressure < room-temperature tensile strength / 3.5
- Pressure < room-temperature yield strength / 1.5
- Pressure < the stress required to cause a creep rate of 0.0001%/1000 hours
- Pressure < the average stress to cause rupture at 100,000 hours / 1.5
- Pressure < the minimum stress to cause rupture at 100,000 hours / 1.25
As a society, we know more, so we can design an “envelope” of safety. Stay inside this region, and we have high confidence that nothing Bad will happen. Go outside it, and… well, we don’t know. Don’t say we didn’t warn you.
This idea of “envelopes” is found in many domains. Here’s a current-time graph of a Rockwell circuit breaker:
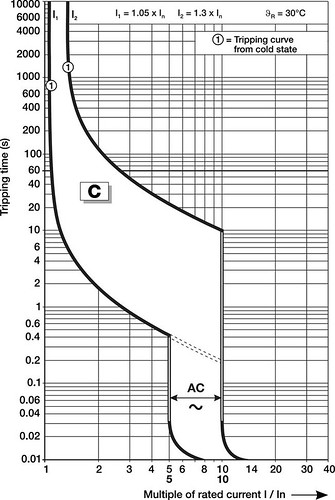
Let’s say you bought a 10A circuit breaker. The ideal circuit breaker will carry 10A all day, and as soon as you hit 10.0001A the breaker will trip within picoseconds! Um, well, you can’t have that, and maybe you don’t want that anyway. What the graph is saying is that if you’re carrying current for hours, you can go up to 10.5A RMS (I1 = 10A nominal × 1.05) for hours, and they guarantee their circuit breaker will not trip. On the other hand, they guarantee their circuit breaker will trip if you carry more than 13A RMS current (I2 = 10A nominal × 1.3) for hours. But it may take a very long time, so if you’re carrying 12.999A RMS for hours, and it doesn’t trip, then the circuit breaker is still operating within specifications. Oh, and by the way this is at 30° C.
If you’re talking about short-term currents that cause the breaker to trip in 60 seconds, you can look on the graph and see that the specifications are around 11A RMS and 26A RMS: the breaker will carry 11A RMS without tripping, and the breaker will trip if the current is more than 26A RMS. When you get to faster times, there are two sets of curves, one at DC and the other at 60Hz AC. The AC current that will trip the breaker quickly is less than in the DC case, because the definition of root-mean-square means that 10A RMS AC has a peak current of \( \sqrt{2} \approx 1.414 \) times higher = 14.14A peak. Again, reading from the graph: currents of less than 50A will not trip the breaker for at least 0.4 seconds, and currents of 100A or more will trip the breaker quickly (within about 33msec, or 2 electrical cycles).
The actual time vs. trip current curve will vary from one particular device to another, and can be anywhere between these limits.
In any case, back to our boiler — there are two things to note:
- We had to add a fudge factor, er, I mean safety factor
- We backed it up with a lot of careful experiment and analysis and review.
And the “we” here is industry (more specifically, ASME). This kind of work is time-consuming and expensive. Let’s call it a “level 2” estimate.
Design Margin for the Everyday Engineer
Now let’s say you’re designing some new product, in a small company. You have an idea: a cordless lithium battery-powered sewing machine! And lithium-ion batteries are expensive, so why not just use those standard battery packs from the cordless tools industry? Then you can make use of their chargers as well. Okay, well how much current is safe to draw from them?
Hmm.
There are a couple of ways you might approach this problem:
- Measure how much current the cordless tools draw
- Measure how much current it takes before the batteries stop working or catch fire — and pick a maximum current that is much lower
You want to measure and analyze as much as your resources allow – and then pick a safety factor that gives you very high confidence that you won’t run into trouble. Be conservative – your company’s long-term survival may depend on it.
Oh, but you can’t be too conservative, because otherwise you won’t be competitive. Nobody wants a sewing machine that can only go through silk and 500 thread count sheets, but can’t stitch hems on a pair of denim jeans.
It’s the same approach that the big boys have, except that you don’t have the resources to come up with a really solid estimate of the minimum allowable design margin, so you just have to be more conservative. And let’s call this a “level 1” estimate.
What does a “level 1” estimate entail?
Well, there isn’t really a standard methodology. That’s the primary difference between levels 1 and 2, that level 2 estimates have the weight and resources of an entire industry behind them to come up with a standard set of general calculations. A level 1 estimate is custom, and that can both work for you and against you. On one hand, custom means you can’t just pull out some standard equation and point to it and say “Tada!”; you have to handle your situation as a fresh unsolved problem. On the other hand, it’s a very specific problem, so that makes it easier: instead of having to reason about, say, copper conductors in general, you can work with the contacts in a particular connector.
There are general techniques for determining design margin, and they involve things like tolerance analysis, experimentation, statistics — and common sense. When you embark on a task like this, what you’re really trying to do is come up with evidence that you present to your peers, that some quantity of interest is within acceptable limits. I usually find that the challenge is not so much in figuring out how to solve some equation, but rather how to piece together a confident argument from a scattering of information that’s available to me.
Just a little example
Here’s a more detailed example. Let’s say I want to figure out how much current I can put into an IRFP260N MOSFET that is turned on continuously, so all its losses are caused by conduction loss, and there is no switching loss.
A little while ago I talked about MOSFET datasheets — the on-resistance of a MOSFET depends on a number of things: the gate-to-source voltage, the junction temperature, the current it’s conducting, and which particular device is being used. The datasheet only tells you one or two assertions — that Rds,on will be less than X if you use the device with a particular gate-to-source voltage V at a particular temperature T conducting a particular current I. For the IRPF260N, it was 40mΩ maximum at 10V Vgs, 28A, and 25°C. If your numbers are different, you’re likely to get different results. But you can use inequalities along with the knowledge of monotonic behavior of a certain type of parts: MOSFET on-resistance decreases when the MOSFET has higher gate-to-source voltage, so if I use it with 11V gate-to-source voltage, rather than 10V, but the same other conditions, I should still get Rds,on ≤ 40mΩ maximum. I can look at the resistance vs. temperature curve to see what happens when junction temperature is elevated:
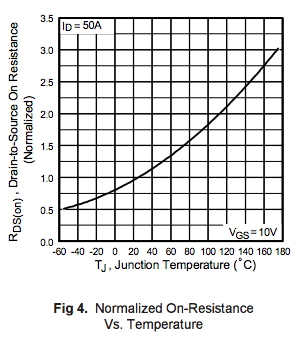
The resistance vs. temperature graph tops out at a maximum of 3.0, so maybe I decide to measure it myself — hypothetically speaking — by putting some samples into an oven at 25°C and then at 150°C, putting moderate (1-2A) amounts current into the device to avoid heating the junction, and I measure an increase of 2.45, 2.63, 2.62, 2.58, and 2.70 in a sample of five devices, which has a mean of μ = 2.596 + a standard deviation of σ = 0.083; I pick μ+6σ on the high end = 3.094 and decide that it’s safe to declare the maximum resistance as 40mΩ × 3.1 = 124mΩ. I measure the thermal characteristics of some circuit boards by dissipating a controlled amount of power into a MOSFET and decide that the thermal resistance from case to ambient is at most 9.1°C / W; the datasheet tells me the part’s junction-to-case thermal resistance is at most 0.5°C / W; so I round up and argue that junction-to-ambient rise is at most 10°C / W. (NOTE: this number depends on the circuit board design; I’m just using a made-up number for the purposes of an example, so don’t use this number in your circuit designs, do the measurements and math yourself.)
I want to keep the junction temperature below 150°C (since that’s where I measured the devices in an oven, and it leaves 25°C margin below the maximum operating temperature of 175°C). I want to operate my system outdoors, and I find a paper, Porous asphalt pavement temperature effects for urban heat island analysis by some researchers at Arizona State University, that measure a ground temperature rise on a hot August day of just under 30°C above ambient air temperature:
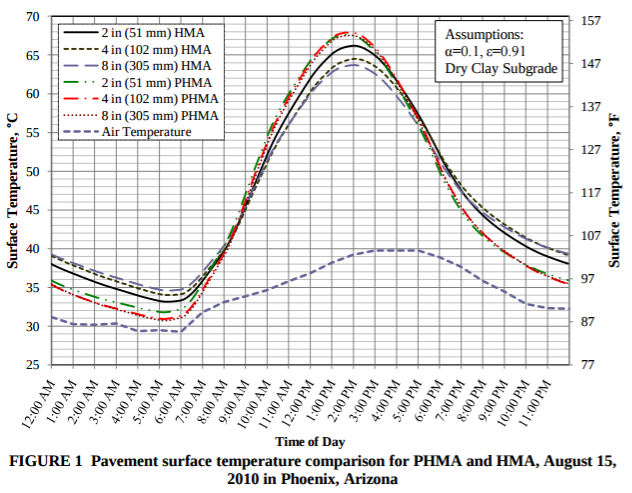
I also find another paper with similar results in Minnesota (63.7°C surface temperature vs. 34.5°C ambient). So I feel safe in specifying a maximum ambient temperature of 80°C ambient and putting that in an requirements document, so that if someone uses my system above 80°C ambient, then I won’t guarantee proper operation, but that should cover the vast majority of environments, including Phoenix, Arizona’s record high of 50°C (122 C) on June 26, 1990, and Cairo, Egypt’s record high (47.8°C = 118°F) although not some more extreme locations such as Palm Springs, California (50.5°C = 123°F on July 28, 1995), Kuwait City, Kuwait (52.1°C = 125.8°F), Lake Havasu City, Arizona (53.3°C = 128°F on June 29, 1994), or Furnace Creek, California (56.7°C = 134°F on July 10, 1913).
Okay, we’re almost done: here’s where the engineering calculations finally come in. A few paragraphs ago I justified that the electrical resistance Rds,on ≤ 124mΩ and the thermal resistance Rja ≤ 10°C / W. A junction-to-ambient rise of 150 - 80 = 70°C (that’s the difference between the maximum junction temperature I want to tolerate, and the maximum ambient temperature I specify), divided by a maximum of Rja = 10°C / W, = 7 W dissipation power, and we solve \( P = I^2R \) for current I to get $$I = \sqrt{P/R} \leq \sqrt{7.0{\rm W}/124{\rm m}\Omega} = 7.51{\rm A}.$$
I redo the calculation just to see how much margin I’ve added by selecting 150°C maximum rather than the device’s 175°C limit:
$$I = \sqrt{P/R} \leq \sqrt{(175^{\circ}{\rm C}-80^{\circ}{\rm C})/(10^{\circ}{\rm C}/{\rm W})/124{\rm m}\Omega} = 8.75{\rm A}.$$
Finally, we need to stop and think about how severe this requirement is. What happens if I exceed this 7.51A limit? It’s not going to cause sudden failure; if I’m above this point by 10% or 15% I’m still okay, and even if the current is larger for a short period of time, the MOSFET case will take a while to heat up — junction-to-case resistance is small and most of the temperature rise is case-to-ambient. Even if the MOSFET does fail, I need to understand what can happen to my system if that happens. Maybe it’s just part of an solar inverter, and the fuse blows and it stops working. Or maybe it’s doing something more critical like an engine cooling pump… which may change how careful my analysis is, or how much extra margin I add.
To recap — this involved several different actions:
- finding datasheet maximum values and using more conservative numbers
- doing experimentation to find the behavior of values not listed with guaranteed bounds in the datasheet, and seeing that they are consistent with typical datasheet graphs
- using statistics to argue worst-case behavior from a small number of samples
- finding published research papers with data I could apply (here the ground temperature rise above ambient)
- adding conditions to operational specifications (maximum of 80°C)
- engineering calculations
- understanding how sensitive my system is to exceeding the limit
- understanding the consequences of exceeding the limit
The Most Important Action
The most important action you need to take when coming up with a “Level 1” estimate, though, is none of the actions I mentioned above. It’s documenting your approach, including the experimental data, the assumptions you made, your calculations, and your conclusion. There are a couple of reasons for doing this:
- You need to make sure your colleagues review it in case you find a mistake.
- You need to present evidence to a regulatory agency.
- Someone later finds that one of your assumptions is incorrect, and has to redo your calculations with different inputs. Usually that someone is you, but that doesn’t save you from documenting things, because you’re probably not going to remember exactly what you did six months earlier.
- Someone wants to be more aggressive and use smaller design margin, and has to figure out what to calculate or measure in order to justify the decrease in engineering margin. (Or vice-versa: they want to be more conservative.)
- Legal action is later taken against your company, and you may need to show that your company took due diligence to ensure safety measures.
(For this last point, the usual disclaimer, that I am not a lawyer, applies. Seek your own legal counsel for determining how to document engineering decisions that may impact safety risks.)
When You Have to Make Fast Decisions
Finally we get to the “level 0” estimate. These are the quick and dirty decisions where you may just have to be right and you don’t have time to go find research papers or run experiments. You need an answer in a short period of time.
This is where the Fermi estimates come in, only instead of trying get the exact answer on average, we want to bias our answer so that in the worst case we’re still safe.
For my IRFP260N MOSFET example, I might go through the same kind of general calculation, but just use an engineering estimate that a TO-247 package should be able to dissipate more than 1W no matter what (it’s much larger than a 1/2W resistor), the datasheet says the on-resistance goes up by a factor of around 3.0 from the asserted Rds,on = 40mΩ at elevated temperatures, then calculate $$I = \sqrt{P/R} \leq \sqrt{1.0{\rm W}/120{\rm m}\Omega} = 2.89{\rm A}.$$
This is much more conservative than the “level 1” estimate. But it was easy and I got to it very quickly. In general, there’s a tradeoff between being conservative and leaving lots of margin (we may be wasting the capability of our device), and being aggressive and trying to find the minimum acceptable margin (we have to put in lots of effort and analysis and testing to make sure we can get the most out of our device but still be safe).
Now wait a minute here… that seems kind of sloppy. And it is. There’s not really a good way around this, but my “level 0” estimates are a judgment call based on experience, gut reactions, and an understanding of the consequences of being wrong. If someone tells me I need to do a quick lab test with 2.5A current on a garden-variety circuit, and I can do the 30-second math above, then I’ll feel comfortable using the IRFP260N MOSFET, with 22 AWG wire (maybe 20 AWG if I’m feeling a little nervous) and other components that I’m comfortable with at the 2.5A level. I’m experienced enough that I know that the issues involved with currents of this level are usually a matter of I2R heating or voltage drop, and those are quick and easy to check. I also know that 2.5A isn’t a lot of current at low voltages, so if I’m dealing with a circuit at 48V or below and 2.5A maximum, I’m not going to worry too much about safety besides the thermal dissipation issues. Whereas a 480V 2.5A circuit or a 48V 25A circuit is a different animal, and I have to do more careful estimation, because the consequences of being wrong are more severe.
So what do you do if you’re a beginner engineer, or you’re working in an area in which you don’t have a lot of expertise? Well, there are four options I can think of:
- find a well-established guideline or standard that applies (in electrical engineering, you find these in cases like circuit-board trade widths or creepage and clearance distances)
- find someone else you can trust with that experience to help advise you
- give up and do a “level 1” estimate, so you can start getting experience and justify that off-the-cuff gut reaction by getting some numbers with justification behind them.
- push back with your manager or customer and assert that you don’t feel comfortable designing or testing a system because of your lack of experience. This is not the best outcome, but in cases where there are potential safety risks, it is better to be overconservative than it is to deal with the risk of injury or property damage.
Other Topics
Before we wrap up for today, there are two side issues I want to bring up.
Consistency, Diminishing Returns, and the Economics of Design Margin
No article on design margin would be complete without mentioning the importance of engineering economics, in particular the need for consistency among multiple related design margins. If you spend two months analyzing whether a circuit board’s current rating can be increased 5% with no significant increase in expected failure rates, but you use a quick off-the-cuff estimate of a connector rating that plugs into the board, something may be wrong.
Remember: there is a tradeoff between using more conservative design margins, which are quick and inexpensive to calculate, but likely to be more expensive to implement for a given performance requirement, and more aggressive design margins, which can take large amounts of work to justify, but likely to reduce implementation cost for that performance requirement. The “level 2” and “level 3” estimates may effectively cost much more than a project’s expected benefit. If I can spend \$100 million on non-recurring engineering work to create and analyze a design that costs me \$2.00 to build a widget with sufficient design margin, and I’m going to sell it for \$4.00, then I’ve got to sell 50 million of them just to break even. Probably not going to happen. Maybe \$1,000 worth of work can help me come up with a design that costs \$2.50 (remember, I have to be more conservative the less thorough my estimation technique is, so that means using more expensive components), whereas \$100,000 worth of work will yield a design that costs \$2.20 to meet the same performance and safety criteria. Increasing the NRE from \$1,000 to \$100,000 (an additional \$99,000) would save me 30 cents per unit, so the breakeven point is 330,000 units: if I’m going to sell millions of these things then it’s worth the effort to spend the \$100K to get that 30 cents per unit, whereas if I’m only going to sell a few thousand, then the quick estimate would be better even if it means it’s going to cost more.
Essentially, the careful creation and review of a design represents an investment, and, theoretically at least, there’s some optimal choice of up-front investment to maximize profits. Probably not to the exactness of “OK, let’s spend exactly \$51,372 on engineering so we can take off 21 cents per unit cost”, but at least understanding the tradeoff lets you get a sense of whether a half-hour’s worth of work or three weeks worth of work are appropriate. And optimizations of this type don’t make sense unless you do them everywhere. If I’m going to be wasteful and spend an extra dollar on connectors just so I can get a design out quickly, it doesn’t make sense to spend five weeks and \$100,000 to find the best design margin for a circuit board to save 30 cents.
This leads to a vague principle of “equipartition”: Engineering teams should be using similar strategies to explore all design tradeoffs, so that the product is optimized as a whole. I’ve heard talk from engineers that automobile manufacturers like Toyota and Honda have a time-to-failure target of around 320,000 km (200,000 miles) for their passenger vehicles; when you get to that point, pretty much every system in a car runs into the end of its useful like. This makes sense for the same reason: there’s no point in spending extra money to have a transmission that lasts 320,000 km but an engine that only lasts 160,000 km.
The important takeaway here isn’t how to do that kind of financial optimization, but just that it exists, and it’s important to keep it in perspective — so that if your boss asks you to do three weeks of design margin analysis on Aspect A of a design, but you see Aspects B and C with similar problems and no time or resources in the schedule to give them any more than a quick lookover, you should raise the issue with your boss. Otherwise the extra costs of requiring more design margin in Aspects B and C may erase the benefit of analyzing Aspect A in such detail.
Darker Thoughts: The Risk Aversion Game and the Temptations of Reduced Margin
I’ve also got a few darker thoughts to share. Here’s where the black swans come home to roost.
Suppose I came to you with an offer: I want to buy life insurance from you. I’ll pay you \$100. If I die tomorrow, you have to pay my heirs \$100,000 — otherwise you can keep the \$100 free and clear, and have no further obligation. Would you accept this offer?
One way to deal with this question is to figure out the expected value if a large number of people came to you with the same offer. You’re going to break even if the odds of your policyholders dying on a given day are 1 in 1001. In that case, for every person you have a payout of \$100,000, there are a thousand people who pay you \$100. One in 1001 in a day works out to a life expectancy of a little less than three years. If the people who come to you have a life expectancy of more than that, it lowers the odds that you will pay out the \$100,000. For example, suppose you are dealing with people whose life expectancy is ten years: roughly one out of every 3653 people will die tomorrow, so you’d expect (on average) to make \$365,200 on the 3652 people who are still alive after tomorrow, and pay out \$100,000 on the one person who dies, leaving you a nice profit of \$265,000, or about \$72.60 per person. Unless you are dealing with the elderly, the ill, drug dealers, or soldiers on active duty, the vast majority of people will have a life expectancy more than 1001 days. So the rational choice is to sell life insurance to anyone who can be expected to live longer than 1001 days.
This is the kind of reasoning that comes from a person who is risk-neutral. The problem here is that for most people, having to pay out \$100,000 is a really horrible outcome, vastly outweighing the benefit of getting \$100. It’s a modest upside, with a very large downside, even if that downside is very unlikely. The reason insurance companies take on this sort of risk is that they have a much larger pool of capital, they handle large numbers of independent cases, and have crunched the numbers so that on average they are guaranteed to make a profit, even if they have to pay out every once in a while. But for the rest of us, if we don’t have those kind of financial resources, the better strategy is to be risk-averse and decline the offer.
There are also cases where instead of risk aversion, people become risk-seeking, sometimes without even being aware of it. Perhaps the risks are so remote that people stop believing they are possible — for example, maybe I spend an hour or two in the sun without putting on sunscreen, because I don’t consider the elevated risk of skin cancer something that is likely to happen to me. If I were to stop and weigh the tradeoffs here (time/inconvenience of putting on sunscreen now, vs. uncertain risk of skin cancer later), the rational risk-averse decision is probably to put on sunscreen.
Or maybe I’m dealing with a remote possibility of something bad happening to someone else, and not to me. Suppose I work on boring old widget designs day after day, and I’ve got this new idea for an ambitious, bleeding-edge product on behalf of my employer: there’s a 98% chance it will work well for the company and I’ll get a bonus, but because it’s so ambitious and bleeding-edge there’s a 2% chance it will bring liabilities that destroy the company along with my job. I might be worried about my job anyway: let’s say I estimate only a 40% chance of maintaining my job this year if I don’t deliver something innovative, so the risk-averse choice for me would be to follow through on this idea (98% is better than 40%) and downplay that risk to my employer, whereas if I think of what’s best for the company, I should cancel it. (I don’t want to know how often this sort of thing happens in the corporate world; look at Nick Leeson who brought down Barings Bank on speculative trades.)
Or maybe I’ve goofed in my understanding of the probabilities something bad will happen: a thousand people come to me with that life insurance offer, so I take it, and they all go to the zoo and die tomorrow from a rampage of rabid monkeys. Now I’m out \$100,000,000. Oops. So much for independent random variables.
Back to engineering margin: we have the same kinds of dilemmas when we make tradeoffs between adding extra margin to be conservative, and using less margin to be more aggressive. If the thing we are guarding against is this remote, unseen, uncertain occurrence, it’s very tempting to cut corners, especially when the more likely alternative gives you greater benefit. If I’m building a bunch of homes on oceanfront property, why should I put them further back from shore when it costs me more to purchase the extra land, and there’s only a small chance of a catastrophic hurricane coming through? Higher profit, better performance, more competitive. The benefits of greed are staring you in the face each day, but the costs of greed… well, do they really exist? Oh, and your competition is probably cutting corners, so you’ll have to do it too, if you want to stay in business — right?
So it’s actually hard to be risk-averse. You can’t just tell yourself you want to avoid risks; you have to go out of your way to identify and quantify them, and remain steadfast against the temptation of lowering your standards. Bear Stearns and Lehman Brothers failed to be risk-averse, and now they’re gone. Exxon failed to be risk-averse in 1989, and BP/Halliburton/Transocean failed to be risk-averse in 2010, and have paid out billions of dollars to settle damages due to oil spills.
But there’s something else disturbing here, and it’s hard for me to put my finger on it. I guess part of it is due to the increasing pace of change in modern society. We are making more and more decisions faster and faster; it took ASME eighty years to decrease boiler safety factors from 5.0 to 3.5 — and that’s after modern boilers had been around for many more decades, since Thomas Savery’s 1698 steam engine and Boulton & Watt‘s use of steam for central heating in the 1780’s. It seems like there’s not enough time these days to get a good, stable understanding of the risks and processes involved in modern technology — remember the earthquake graphs earlier in this article? If something bad happens only once every twenty years or so, then how can you possibly get a good understanding of its probability of occurrence unless you wait a few decades? Meanwhile, even five years is an eternity in technology development — by the time something like a computer or cell phone has been around for five years, something completely new is likely to take its place, and comprehensive reliability studies will be obsolete.
Aside from the pace of change, maybe it’s the fact that as our society becomes more and more complicated, the opportunities multiply for the gremlins of complexity to emerge. Not only are there are more distinct types of failures in complex systems, but there is also an amplification of failure from the component level to the system level: if you want a system with 99.99% reliability, either the components have to be much more reliable than that, or there need to be mechanisms for redundancy or self-repair. Services like electricity, oil and gasoline, the telephone, or the Internet, which were originally just a convenience, are now a vital part of our society’s infrastructure — unless improving their reliability is actively and openly discussed by both providers and consumers, it puts every dependent system at risk. And all this complexity forces us to put our trust in the efforts of an ever-increasing number of people whom we never even see, to ensure that sufficient margin is being provided against unwanted risks. (What temperature is being used to kill the bacteria in my canned soup? Is it enough? I have no way of knowing.) If I want to be misanthropic for a day, I just can stay inside my house and refuse to interact with anyone — but I can’t get away from the interdependence of my life on the decisions of others, unless I want to eschew modern living and be a primitive survivalist. Which I don’t.
Wrapup
Okay, enough of the doom and gloom talk. What have we learned?
- Design margin is a way to allocate extra resources to cover uncertainties.
- There is a tradeoff between the amount of design margin and the effort needed to show that design margin is sufficient
- lots of design margin leads to a quick estimate (low cost estimate, high cost design margin)
- optimizing design margin can be a very expensive effort (low cost design margin, high cost estimate).
- There are different degrees of effort needed to estimate sufficient design margin; we’ve looked at four categories, what I call “Level 3”, “Level 2”, “Level 1”, and “Level 0”:
- Level 3: Perfect knowledge of the system in question, and all relevant processes; reduces the problem to calculation of probability distributions. Unattainable and impractical for all but the simplest of systems.
- Level 2: Industry-wide or government initiatives to understand general situations. Extremely expensive, involves extensive studies.
- Level 1: Case-specific studies utilizing a variety of techniques to argue appropriate design margin: use of datasheet values, tolerance analysis, statistical analysis, understanding of mechanisms, identifying and applying published research, providing limits to operational specifications, analysis of sensitivity and risks of insufficient design margin, and communication skills
- Level 0: Quick shoot-from-the-hip estimate based on experience and/or rules of thumb.
- Part of the uncertainties come from rare, extreme events aka “black swans”
- in some cases (earthquakes, for example) these may follow well-determined processes with too few samples to adequately understand their frequency of occurrence
- other cases are completely unpredictable
- assumption of Gaussian or other traditional probability distributions is underconservative; black swans bring “long tails” to the true probability distributions
- Achieving an adequate estimate of design margin can be difficult, but don’t lose faith:
- Practice, practice, practice! As you gain experience in estimating design margin, you will improve the quality and confidence of your estimates.
- Consult a professional engineering firm if necessary.
Best of luck in your next engineering project!
© 2015 Jason M. Sachs, all rights reserved.


- Comments
- Write a Comment Select to add a comment
This is also why (here in the EU) we have strong consumer protection laws that put the consequences of relying on something not disclosed by the vendor onto the vendor. If you sell me a boiler suitable for 300 kPa rupture pressure, but neglect to tell me that it must never be exposed to a pH lower than 6.5 or greater than 7.5, then you're in trouble when I use it with UK tap water (allowable pH range 6.5 to 9.5).

What a great article! I wish discussions of engineering trade-offs, safety margins, and economics had been a greater part of my undergraduate education. These topics were of course touched on, but not enough to emphasize the individual engineer's responsibility to critically think about the problems being solved and justify the approach.
I really enjoy reading your blog. Thank you for sharing your knowledge and experience with the community.
To post reply to a comment, click on the 'reply' button attached to each comment. To post a new comment (not a reply to a comment) check out the 'Write a Comment' tab at the top of the comments.
Please login (on the right) if you already have an account on this platform.
Otherwise, please use this form to register (free) an join one of the largest online community for Electrical/Embedded/DSP/FPGA/ML engineers:


