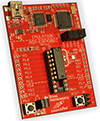
Matlab code to plot values from port in real time
clc
clear all
close all
s1 = serial('COM26', 'BaudRate', 57600);
set(s1,'Terminator',35);
    fopen(s1);
V=[];
val='';
time=200;
count=0;
f=0;
 %   **********************************************************************
 %    Read Serial values
tic
tt=toc;
while(tt<time)
    val=fscanf(s1);
    tt=toc;

%########################################################################
 A=[];
 B=[];
 C=[];
 b=[];
 x=[];
 j=1;


     if(j<numel(val))
         while(val(j)~='$')
             a=val(j);
             b=[b,a];
             j=j+1;
         end
         A=[A,str2num(b)];
         j=j+1;
         b=[];
         while(val(j)~='*')
             a=val(j);
             b=[b,a];
             j=j+1;
         end
         B=[B,str2num(b)];
         j=j+1;
         b=[];
         while(val(j)~='#')
             a=val(j);
             b=[b,a];
             j=j+1;
         end
         C=[C,str2num(b)];
         i=j;
         b=[];
         f=f+i;
     end

x=[x,round(toc)];
if(~(isempty(A)&&isempty(B)&&isempty(C)))
    subplot(1,2,1)
    plot(x,A,'--rs','LineWidth',2,'MarkerEdgeColor','k','MarkerFaceColor','r','MarkerSize',5);
    hold on % if u want this in different graph remove hold on and add "figure" command before each graph;
    plot(x,B,'--rs','LineWidth',2,'MarkerEdgeColor','k','MarkerFaceColor','g','MarkerSize',5);
    grid on;
    subplot(1,2,2)
    plot(x,(B/(A+B))*100,'--rs','LineWidth',2,'MarkerEdgeColor','k','MarkerFaceColor','m','MarkerSize',5);
    hold on
    plot(x,C,'--rs','LineWidth',2,'MarkerEdgeColor','k','MarkerFaceColor','b','MarkerSize',5);
    grid on;
    pause(.01);
end

end
hold off
fclose(s1);Plotting 16-bit binary data
%Script to load and plot 16-bit accelerometer data
printf "Running acceleration data analysis script\r\n"

clear *	%Clear all variables

ts = (1/1000);	%1KHz sampling rate

%Path to TXT file with accelerometer samples
accel_data_path = "accel_data.txt";

%Open the acceleration data file as read-only, binary mode
file_accel_data = fopen(accel_data_path,"rb");

%Read unit16 samples from TXT file into an array
%count is # of samples, val is array of values
[val,count] = fread(file_accel_data,Inf,"uint16");

fclose(file_accel_data);

%Generate a time vector from t=0 to the end determined by count and sampling time
tmax = (count-1)*ts;
t=0:ts:tmax;

%Open figure 1
figure(1)

%Plot accelerometer samples
plot(t,val','1')

%Make the plot look pretty
title("Raw Sampled Accelerometer Data")
xlabel("Time (s)")
ylabel("Accelerometer Data")

%Save the plot to disk
print("plots/raw_accel_data.png")Plotting 16-bit binary data
%Script to load and plot 16-bit accelerometer data
printf "Running acceleration data analysis script\r\n"

clear *	%Clear all variables

ts = (1/1000);	%1KHz sampling rate

%Path to TXT file with accelerometer samples
accel_data_path = "accel_data.txt";

%Open the acceleration data file as read-only, binary mode
file_accel_data = fopen(accel_data_path,"rb");

%Read unit16 samples from TXT file into an array
%count is # of samples, val is array of values
[val,count] = fread(file_accel_data,Inf,"uint16");

fclose(file_accel_data);

%Generate a time vector from t=0 to the end determined by count and sampling time
tmax = (count-1)*ts;
t=0:ts:tmax;

%Open figure 1
figure(1)

%Plot accelerometer samples
plot(t,val','1')

%Make the plot look pretty
title("Raw Sampled Accelerometer Data")
xlabel("Time (s)")
ylabel("Accelerometer Data")

%Save the plot to disk
print("plots/raw_accel_data.png")Matlab code to plot values from port in real time
clc
clear all
close all
s1 = serial('COM26', 'BaudRate', 57600);
set(s1,'Terminator',35);
    fopen(s1);
V=[];
val='';
time=200;
count=0;
f=0;
 %   **********************************************************************
 %    Read Serial values
tic
tt=toc;
while(tt<time)
    val=fscanf(s1);
    tt=toc;

%########################################################################
 A=[];
 B=[];
 C=[];
 b=[];
 x=[];
 j=1;


     if(j<numel(val))
         while(val(j)~='$')
             a=val(j);
             b=[b,a];
             j=j+1;
         end
         A=[A,str2num(b)];
         j=j+1;
         b=[];
         while(val(j)~='*')
             a=val(j);
             b=[b,a];
             j=j+1;
         end
         B=[B,str2num(b)];
         j=j+1;
         b=[];
         while(val(j)~='#')
             a=val(j);
             b=[b,a];
             j=j+1;
         end
         C=[C,str2num(b)];
         i=j;
         b=[];
         f=f+i;
     end

x=[x,round(toc)];
if(~(isempty(A)&&isempty(B)&&isempty(C)))
    subplot(1,2,1)
    plot(x,A,'--rs','LineWidth',2,'MarkerEdgeColor','k','MarkerFaceColor','r','MarkerSize',5);
    hold on % if u want this in different graph remove hold on and add "figure" command before each graph;
    plot(x,B,'--rs','LineWidth',2,'MarkerEdgeColor','k','MarkerFaceColor','g','MarkerSize',5);
    grid on;
    subplot(1,2,2)
    plot(x,(B/(A+B))*100,'--rs','LineWidth',2,'MarkerEdgeColor','k','MarkerFaceColor','m','MarkerSize',5);
    hold on
    plot(x,C,'--rs','LineWidth',2,'MarkerEdgeColor','k','MarkerFaceColor','b','MarkerSize',5);
    grid on;
    pause(.01);
end

end
hold off
fclose(s1);


