Contents:
Introduction
In this post, I'll show you how to do Rust development on a new Adafruit Feather nRF52840 Express board, using the initial VolksEEG Project prototype application.
I used Ubuntu 20.04. However, because development takes place under VS Code running in a Docker container, you should be able to follow the same procedure on other development platforms with only minor platform-specific tweaks.
The application is based on a Rust RTIC (Real-Time Interrupt-driven Concurrency) demonstration app. Once the board has been flashed with the application, it runs as a serial echo-server. This is a nice way to prove out the development environment and device USB path, and have a playground for experimenting with Rust and RTIC.
This builds on wiki pages and code in the VolksEEG repo contributed by other project participants:
A big thank you to them for providing all the source material so I could learn how to do this!
I don't know much about working with Docker, so that's another learning curve along with the other parts here. Given that this environment uses tools layered on top of tools, it can be challenging to diagnose and fix the problem when a failure occurs. I've included a container build failure and its fix as an example of how to address one such problem.
Setup
Hardware
Reference information:
Workstation
I'm running Ubuntu 20.04 x86_64 on a low-cost HP-14-dq0xxx laptop (Intel® Celeron(R) N4020 CPU @ 1.10GHz × 2, 4 GB RAM, 64 GB eMMC). This is a very low-end system, but has been sufficient so far.
sbranam@sbranam-HP-Laptop-14-dq0xxx:~\$ uname -a
Linux sbranam-HP-Laptop-14-dq0xxx 5.11.0-41-generic #45~20.04.1-Ubuntu SMP Wed Nov 10 10:20:10 UTC 2021 x86_64 x86_64 x86_64 GNU/Linux
Software Installed:
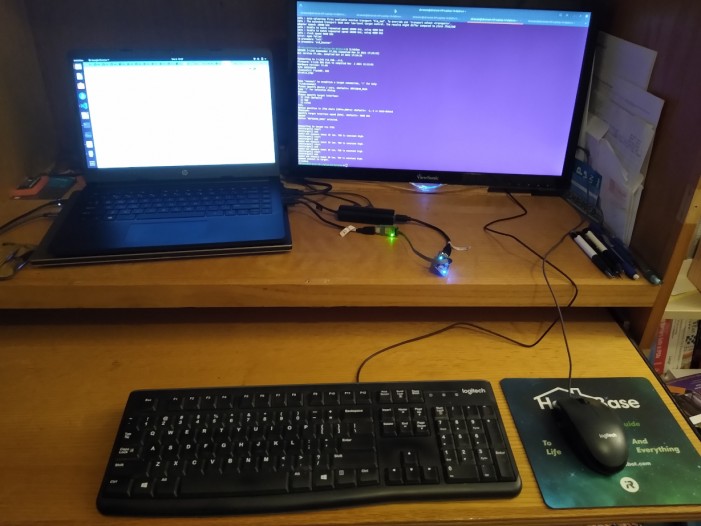
Workstation:
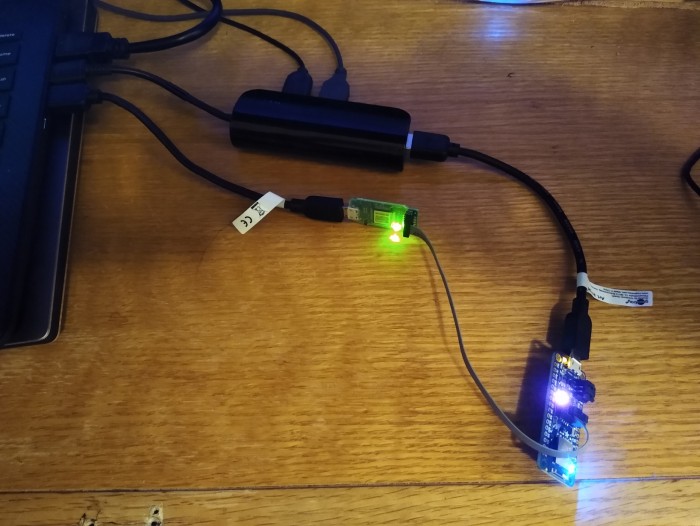
Board with USB and J-Link, powered up:
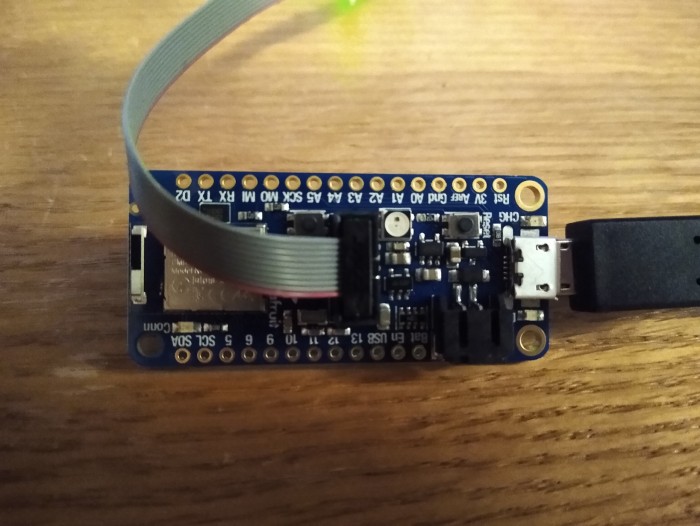
Closeup of board, powered down:
Software Checks
These verify basic board connection and operation.
USB Device
sbranam@sbranam-HP-Laptop-14-dq0xxx:~\$ lsusb
...
Bus 001 Device 013: ID 239a:8029 Generic Flash Card Reader/Writer
...
sbranam@sbranam-HP-Laptop-14-dq0xxx:~\$ ls -l /dev/ttyACM0
crw-rw---- 1 root dialout 166, 0 Dec 6 17:45 /dev/ttyACM0
Minicom
This connects to the board USB and shows the output of the pre-loaded flash image running on the board as it comes from Adafruit:
sbranam@sbranam-HP-Laptop-14-dq0xxx:~\$ sudo minicom -D /dev/ttyACM0 -b 115200
Welcome to minicom 2.7.1
OPTIONS: I18n
Compiled on Dec 23 2019, 02:06:26.
Port /dev/ttyACM0, 17:55:28
Press CTRL-A Z for help on special keys
02-01-06-19-16-F7-FD-01-0F-0E-59-2D-C0-2F-5D-68-92-DB-30-F0-BB-A1-C1-0B-00-00-00-00-03
Timestamp Addr Rssi Data
000580802 E7:A7:B7:95:89:22 -59 02-01-04-03-03-07-FE-10-FF-A7-05-05-10-01-00-00-00-00-00-00-02-1F-00-CA-03-19-00-00-02-0A-00
Timestamp Addr Rssi Data
000580815 7E:C8:6C:02:DTimestamp Addr Rssi Data
000609435 E7:A7:B7:95:89:22 -56 02-01-04-03-03-07-FE-10-FF-A7-05-05-10-01-00-00-00-00-00-00-02-1F-00-CA-03-19-00-00-02-0A-00
Timestamp Addr Rssi Data
000609520 E7:A7:B7:95:89:22 -62 02-01-04-03-03-07-FE-10-FF-A7-05-05-10-01-00-00-00-00-00-00-02-1F-00-CA-03-19-00-00-02-0A-00
Timestamp Addr Rssi Data
000609527 7E:C8:6C:02:DD:6E -71 02-01-06-13-FF-4C-00-0C-0E-00-78-23-74-B6-96-DB-77-0D-30-45-56-FC-A5
Timestamp Addr Rssi Data
000609610 E7:A7:B7:95:89:22 -56 02-01-04-03-03-07-FE-10-FF-A7-05-05-10-01-00-00-00-00-00-00-02-1F-00-CA-03-19-00-00-02-0A-00
Timestamp Addr Rssi Data
000609622 7E:C8:6C:02:DD:6E -67 02-01-06-13-FF-4C-00-0C-0E-00-78-23-74-B6-96-DB-77-0D-30-45-56-FC-A5
Timestamp Addr Rssi Data
000609718 7E:C8:6C:02:DD:6E -83 02-01-06-13-FF-4C-00-0C-0E-00-78-23-74-B6-96-DB-77-0D-30-45-56-FC-A5
Timestamp Addr Rssi Data
000609814 7E:C8:6C:02:DD:6E -71 02-01-06-13-FF-4C-00-0C-0E-00-78-23-74-B6-96-DB-77-0D-30-45-56-FC-A5
...
Timestamp Addr Rssi Data
000656634 7E:C8:6C:02:DD:6E -70 02-01-06-13-FF-4C-00-0C-0E-00-78-23-74-B6-96-DB-77-0D-30-45-56-FC-A5
Timestamp Addr Rssi Data
000656700 FA:0D:AC:42:4A:42 -68 02-01-06-19-16-F7-FD-01-0F-0E-59-2D-C0-2F-5D-68-92-DB-30-F0-BB-A1-C1-0B-00-00-00-00-03
CTRL-A Z for help | 115200 8N1 | NOR | Minicom 2.7.1 | VT102 | Offline | ttyACM0
JLinkExe
This connects over the J-Link debugger, via the SWD target interface:
sbranam@sbranam-HP-Laptop-14-dq0xxx:~\$ JLinkExe
SEGGER J-Link Commander V7.58c (Compiled Nov 24 2021 17:24:52)
DLL version V7.58c, compiled Nov 24 2021 17:24:36
Connecting to J-Link via USB...O.K.
Firmware: J-Link EDU Mini V1 compiled Nov 2 2021 11:12:01
Hardware version: V1.00
S/N: 801035449
License(s): FlashBP, GDB
VTref=3.272V
Type "connect" to establish a target connection, '?' for help
J-Link>connect
Please specify device / core. : NRF52840_XXAA
Type '?' for selection dialog
Device>
Please specify target interface:
J) JTAG (Default)
S) SWD
T) cJTAG
TIF>s
Specify target interface speed [kHz]. : 4000 kHz
Speed>
Device "NRF52840_XXAA" selected.
Connecting to target via SWD
InitTarget() start
InitTarget() end
Found SW-DP with ID 0x2BA01477
DPIDR: 0x2BA01477
CoreSight SoC-400 or earlier
Scanning AP map to find all available APs
AP[2]: Stopped AP scan as end of AP map has been reached
AP[0]: AHB-AP (IDR: 0x24770011)
AP[1]: JTAG-AP (IDR: 0x02880000)
Iterating through AP map to find AHB-AP to use
AP[0]: Core found
AP[0]: AHB-AP ROM base: 0xE00FF000
CPUID register: 0x410FC241. Implementer code: 0x41 (ARM)
Found Cortex-M4 r0p1, Little endian.
FPUnit: 6 code (BP) slots and 2 literal slots
CoreSight components:
ROMTbl[0] @ E00FF000
[0][0]: E000E000 CID B105E00D PID 000BB00C SCS-M7
[0][1]: E0001000 CID B105E00D PID 003BB002 DWT
[0][2]: E0002000 CID B105E00D PID 002BB003 FPB
[0][3]: E0000000 CID B105E00D PID 003BB001 ITM
[0][4]: E0040000 CID B105900D PID 000BB9A1 TPIU
[0][5]: E0041000 CID B105900D PID 000BB925 ETM
Cortex-M4 identified.
J-Link>halt
PC = 00030886, CycleCnt = 0BCB3BD1
R0 = 00000001, R1 = 00000000, R2 = E000E100, R3 = 00000000
R4 = 20008C94, R5 = 00000000, R6 = 0000000A, R7 = 000064D4
R8 = 0000000A, R9 = 20007788, R10= 10000000, R11= E000ED00
R12= A5A5A5A5
SP(R13)= 20007C58, MSP= 2003FF98, PSP= 20007C58, R14(LR) = 00030849
XPSR = 61000000: APSR = nZCvq, EPSR = 01000000, IPSR = 000 (NoException)
CFBP = 02000000, CONTROL = 02, FAULTMASK = 00, BASEPRI = 00, PRIMASK = 00
FPS0 = 00000000, FPS1 = 00000000, FPS2 = 00000000, FPS3 = 00000000
FPS4 = 00000000, FPS5 = 00000000, FPS6 = 00000000, FPS7 = 00000000
FPS8 = 00000000, FPS9 = 00000000, FPS10= 00000000, FPS11= 00000000
FPS12= 00000000, FPS13= 00000000, FPS14= 00000000, FPS15= 00000000
FPS16= 00000000, FPS17= 00000000, FPS18= 00000000, FPS19= 00000000
FPS20= 00000000, FPS21= 00000000, FPS22= 00000000, FPS23= 00000000
FPS24= 00000000, FPS25= 00000000, FPS26= 00000000, FPS27= 00000000
FPS28= 00000000, FPS29= 00000000, FPS30= 00000000, FPS31= 00000000
FPSCR= 01000000
J-Link>
The board does not support JTAG. Attempting to connect via JTAG causes the FTHR840BOOT device to auto-mount after several seconds; it automatically disconnects after 5 minutes. (The Adafruit Update Bootloader section says to double-click the reset button to get to this bootloader drive normally).
sbranam@sbranam-HP-Laptop-14-dq0xxx:~\$ JLinkExe
SEGGER J-Link Commander V7.58c (Compiled Nov 24 2021 17:24:52)
DLL version V7.58c, compiled Nov 24 2021 17:24:36
Connecting to J-Link via USB...O.K.
Firmware: J-Link EDU Mini V1 compiled Nov 2 2021 11:12:01
Hardware version: V1.00
S/N: 801035449
License(s): FlashBP, GDB
VTref=3.280V
Type "connect" to establish a target connection, '?' for help
J-Link>connect
Please specify device / core. : NRF52840_XXAA
Type '?' for selection dialog
Device>
Please specify target interface:
J) JTAG (Default)
S) SWD
T) cJTAG
TIF>
Device position in JTAG chain (IRPre,DRPre) : -1,-1 => Auto-detect
JTAGConf>
Specify target interface speed [kHz]. : 4000 kHz
Speed>
Device "NRF52840_XXAA" selected.
Connecting to target via JTAG
InitTarget() start
InitTarget() end
Could not measure total IR len. TDO is constant high.
InitTarget() start
InitTarget() end
Could not measure total IR len. TDO is constant high.
InitTarget() start
InitTarget() end
Could not measure total IR len. TDO is constant high.
InitTarget() start
InitTarget() end
Could not measure total IR len. TDO is constant high.
Cannot connect to target.
J-Link>q
FTHR840BOOT Contents
sbranam@sbranam-HP-Laptop-14-dq0xxx:~\$ cd /media/sbranam/FTHR840BOOT/
sbranam@sbranam-HP-Laptop-14-dq0xxx:/media/sbranam/FTHR840BOOT\$ ls -l
total 151
-rw-r--r-- 1 sbranam sbranam 153088 Dec 31 1979 CURRENT.UF2
-rw-r--r-- 1 sbranam sbranam 108 Dec 31 1979 INDEX.HTM
-rw-r--r-- 1 sbranam sbranam 212 Dec 31 1979 INFO_UF2.TXT
sbranam@sbranam-HP-Laptop-14-dq0xxx:/media/sbranam/FTHR840BOOT\$ cat INDEX.HTM
location.replace("https://www.adafruit.com/");
sbranam@sbranam-HP-Laptop-14-dq0xxx:/media/sbranam/FTHR840BOOT\$ cat INFO_UF2.TXT
UF2 Bootloader 0.2.6 lib/nrfx (v1.1.0-1-g096e770) lib/tinyusb (legacy-525-ga1c59649) s140 6.1.1
Model: Adafruit Feather nRF52840 Express
Board-ID: NRF52-Bluefruit-v0
Bootloader: s140 6.1.1
Date: Dec 21 2018
OpenOCD
Run in a separate terminal. A quick breakdown of the command:
- The debug interface to the board is via
J-Link (vs. for example, ST-Link).
- The transport protocol is
SWD (vs. for example, JTAG).
- The target device is in the
nRF52 series (vs. for example, STM32).
sbranam@sbranam-HP-Laptop-14-dq0xxx:~\$ openocd -f interface/jlink.cfg -c "transport select swd" -f target/nrf52.cfg
Open On-Chip Debugger 0.10.0
Licensed under GNU GPL v2
For bug reports, read
http://openocd.org/doc/doxygen/bugs.html
swd
adapter speed: 10000 kHz
cortex_m reset_config sysresetreq
Info : No device selected, using first device.
Info : J-Link EDU Mini V1 compiled Nov 2 2021 11:12:01
Info : Hardware version: 1.00
Info : VTarget = 3.274 V
Info : Reduced speed from 10000 kHz to 4000 kHz (maximum).
Info : Reduced speed from 10000 kHz to 4000 kHz (maximum).
Info : clock speed 10000 kHz
Info : SWD DPIDR 0x2ba01477
Info : nrf52.cpu: hardware has 6 breakpoints, 4 watchpoints
VolksEEG/eeg-device-firmware
Repo: VolksEEG/eeg-device-firmware (forked from VolksEEG)
PR "Merging initial implementation of the PC communications interface"
Pull Request #2
This version of the application is a simple serial echo-server: it opens a USB serial device and echoes any characters received. This is the intial prototype of the PC interface to stream EEG data to a USB-connected PC.
Container
Using VS Code, open this repo in a Dev Container (see Developing inside a Container). The container includes the Rust tools, including probe-rs, which allows debugging with a J-Link pod via OpenOCD over SWD. Everything is setup to run on a Nordic nRF52840_xxAA device.
The .devcontainer/ directory contains two files that configure the environment, providing VS Code extensions and Linux tools:
-
devcontainer.json configures VS Code to run in the container.
-
Dockerfile configures the container for Docker.
When you open the folder in a container for the first time, VS Code creates the container. This builds all the resources listed in the configuration.
Container Build Failure
Building the container initially fails. This serves as a useful example of what to do in this situation.
--- stderr
thread 'main' panicked at 'Unable to find libudev: "pkg-config" "--libs" "--cflags" "libudev" did not exit successfully: exit status: 1
error: could not find system library 'libudev' required by the 'hidapi' crate
--- stderr
Package libudev was not found in the pkg-config search path.
Perhaps you should add the directory containing 'libudev.pc'
to the PKG_CONFIG_PATH environment variable
No package 'libudev' found
', /usr/local/cargo/registry/src/github.com-1ecc6299db9ec823/hidapi-1.3.0/build.rs:55:54
note: run with 'RUST_BACKTRACE=1' environment variable to display a backtrace
warning: build failed, waiting for other jobs to finish...
[2021-12-11T20:03:15.623Z] error: failed to compile 'probe-run v0.3.1', intermediate artifacts can be found at '/tmp/cargo-install2Mf7Ei'
Caused by:
build failed
Summary Successfully installed cargo-binutils! Failed to install probe-run (see error(s) above).
[2021-12-11T20:03:15.624Z] error
[2021-12-11T20:03:15.625Z] : some crates failed to install
[3:47 PM]
[2021-12-11T20:03:15.625Z]
[2021-12-11T20:03:16.114Z] The command '/bin/sh -c cargo install cargo-binutils probe-run' returned a non-zero code: 101
[2021-12-11T20:03:16.126Z] Stop (460061 ms): Run: docker build -f /home/sbranam/repos/eeg-device-firmware/.devcontainer/Dockerfile -t vsc-eeg-device-firmware-09213f71b2a9a6a22eec247ac1b0d25b --build-arg VARIANT=bullseye /home/sbranam/repos/eeg-device-firmware/.devcontainer
[2021-12-11T20:03:16.135Z] Command failed: docker build -f /home/sbranam/repos/eeg-device-firmware/.devcontainer/Dockerfile -t vsc-eeg-device-firmware-09213f71b2a9a6a22eec247ac1b0d25b --build-arg VARIANT=bullseye /home/sbranam/repos/eeg-device-firmware/.devcontainer
This is because the hidapi crate requires the libudev library, which is not provided by default.
Container Build Fix
Fix the build by adding libudev-dev to the Dockerfile apt-get install command:
diff --git a/.devcontainer/Dockerfile b/.devcontainer/Dockerfile
index 31c86c4..2ad34a2 100644
--- a/.devcontainer/Dockerfile
+++ b/.devcontainer/Dockerfile
@@ -5,7 +5,7 @@ ARG VARIANT="bullseye"
FROM mcr.microsoft.com/vscode/devcontainers/rust:0-\${VARIANT}
RUN apt-get update && export DEBIAN_FRONTEND=noninteractive \
- && apt-get -y install --no-install-recommends build-essential gdb-multiarch libusb-1.0 openocd
+ && apt-get -y install --no-install-recommends build-essential gdb-multiarch libusb-1.0 openocd libudev-dev
RUN rustup component add clippy llvm-tools-preview rustfmt
RUN cargo install cargo-binutils probe-run
This results in a successful open of the container.
Opened Container
All subsequent operations take place in VS Code in the container.
sbranam@sbranam-HP-Laptop-14-dq0xxx:~/repos/eeg-device-firmware\$ docker ps
CONTAINER ID IMAGE COMMAND CREATED STATUS PORTS NAMES
7e4b45d20e7a vsc-eeg-device-firmware-09213f71b2a9a6a22eec247ac1b0d25b-uid "/bin/sh -c 'echo Co…" 6 hours ago Up 6 hours priceless_kare
Debugging
The VS Code debugger interface runs probe-rs, which runs OpenOCD (with gdb-server) and gdb.
File openocd.cfg selects the J-Link interface with SWD transport, for an nRF52 target.
This opens the VS Code debugger GUI (see Visual Studio Code: Debugging), including the source code pane, with the following outputs:
-
DEBUG CONSOLE: gdb terminal interface.
-
TERMINAL Cargo Build (debug): Rust build output.
-
TERMINAL gdb-server: OpenOCD output.
You can use the VS Code debugger source pane to set breakpoints. You can use the debugger GUI toolbar to run the code or step through it.
Processes:
sbranam@sbranam-HP-Laptop-14-dq0xxx:~/repos/eeg-device-firmware\$ ps aux | grep -e docker -e openocd -e gdb
root 1253 0.0 0.9 1020892 35072 ? Ssl Dec08 0:43 /usr/bin/dockerd -H fd:// --containerd=/run/containerd/containerd.sock
sbranam 171005 0.0 1.4 683708 55664 ? Sl 21:46 0:00 docker exec -i -u vscode -e VSCODE_REMOTE_CONTAINERS_SESSION=f92717a4-1aab-498c-bead-8930d3e563bd1639277215491 7e4b45d20e7a80191ae6d9b78eabbeff2dc663a29f02824290efe06d93feda7f /bin/sh
sbranam 171046 0.0 1.4 683708 56088 ? Sl 21:46 0:00 docker exec -i -u root 7e4b45d20e7a80191ae6d9b78eabbeff2dc663a29f02824290efe06d93feda7f /bin/sh
sbranam 171084 0.0 1.4 683708 56428 ? Sl 21:46 0:00 docker exec -i -u vscode -e REMOTE_CONTAINERS_SOCKETS=["/tmp/vscode-ssh-auth-6f5f681c196403fc48cb5bec39b949b35f73cc86.sock","/home/vscode/.gnupg/S.gpg-agent"] -e REMOTE_CONTAINERS_IPC=/tmp/vscode-remote-containers-ipc-6f5f681c196403fc48cb5bec39b949b35f73cc86.sock 7e4b45d20e7a80191ae6d9b78eabbeff2dc663a29f02824290efe06d93feda7f /home/vscode/.vscode-server/bin/3a6960b964327f0e3882ce18fcebd07ed191b316/node /tmp/vscode-remote-containers-server-6f5f681c196403fc48cb5bec39b949b35f73cc86.js
sbranam 171216 0.1 1.5 757440 57572 ? Sl 21:46 0:00 docker exec -i -u vscode -e VSCODE_REMOTE_CONTAINERS_SESSION=f92717a4-1aab-498c-bead-8930d3e563bd1639277215491 7e4b45d20e7a80191ae6d9b78eabbeff2dc663a29f02824290efe06d93feda7f /home/vscode/.vscode-server/bin/3a6960b964327f0e3882ce18fcebd07ed191b316/node -e ????const net = require('net'); ????process.stdin.pause(); ????const client = net.createConnection({ port: 46117 }, () => { ?????client.pipe(process.stdout); ?????process.stdin.pipe(client); ????}); ????client.on('close', function (hadError) { ?????console.error(hadError ? 'Remote close with error' : 'Remote close'); ?????process.exit(hadError ? 1 : 0); ????}); ????client.on('error', function (err) { ?????process.stderr.write(err && (err.stack || err.message) || String(err)); ????}); ???
sbranam 171311 0.1 1.4 757440 56436 ? Sl 21:47 0:00 docker exec -i -u vscode -e VSCODE_REMOTE_CONTAINERS_SESSION=f92717a4-1aab-498c-bead-8930d3e563bd1639277215491 7e4b45d20e7a80191ae6d9b78eabbeff2dc663a29f02824290efe06d93feda7f /home/vscode/.vscode-server/bin/3a6960b964327f0e3882ce18fcebd07ed191b316/node -e ????const net = require('net'); ????process.stdin.pause(); ????const client = net.createConnection({ port: 46117 }, () => { ?????client.pipe(process.stdout); ?????process.stdin.pipe(client); ????}); ????client.on('close', function (hadError) { ?????console.error(hadError ? 'Remote close with error' : 'Remote close'); ?????process.exit(hadError ? 1 : 0); ????}); ????client.on('error', function (err) { ?????process.stderr.write(err && (err.stack || err.message) || String(err)); ????}); ???
sbranam 171581 1.0 0.2 25856 9120 ? Sl 21:47 0:01 openocd -c gdb_port 50000 -c tcl_port 50001 -c telnet_port 50002 -s /workspaces/eeg-device-firmware -f ./openocd.cfg -c tpiu config internal :50003 uart off 8000000 2000000
sbranam 171584 0.2 1.1 242092 43768 ? Sl 21:47 0:00 /usr/bin/gdb-multiarch -q --interpreter=mi2 /workspaces/eeg-device-firmware/target/thumbv7em-none-eabihf/debug/volks-fw
TERMINAL gdb-server Output
[2021-12-11T22:01:07.831Z] SERVER CONSOLE DEBUG: onBackendConnect: gdb-server session connected. You can switch to "DEBUG CONSOLE" to see GDB interactions.
Open On-Chip Debugger 0.11.0-rc2
Licensed under GNU GPL v2
For bug reports, read
http://openocd.org/doc/doxygen/bugs.html
Info : Listening on port 50003 for armv7m_trace connections
Info : Listening on port 50001 for tcl connections
Info : Listening on port 50002 for telnet connections
Info : J-Link EDU Mini V1 compiled Nov 2 2021 11:12:01
Info : Hardware version: 1.00
Info : VTarget = 3.290 V
Info : clock speed 1000 kHz
Info : SWD DPIDR 0x2ba01477
Info : nrf52.cpu: hardware has 6 breakpoints, 4 watchpoints
Info : starting gdb server for nrf52.cpu on 50000
Info : Listening on port 50000 for gdb connections
Info : accepting 'armv7m_trace' connection on tcp/50003
Info : accepting 'gdb' connection on tcp/50000
Info : nRF52840-xxAA(build code: D0) 1024kB Flash, 256kB RAM
undefined debug reason 8 - target needs reset
target halted due to debug-request, current mode: Thread
xPSR: 0x01000000 pc: 0x00000100 msp: 0x20040000
target halted due to debug-request, current mode: Thread
xPSR: 0x01000000 pc: 0x00000100 msp: 0x20040000
target halted due to debug-request, current mode: Thread
xPSR: 0x01000000 pc: 0x00000100 msp: 0x20040000
target halted due to debug-request, current mode: Thread
xPSR: 0x01000000 pc: 0x00000100 msp: 0x20040000
DEBUG CONSOLE Output
Please check TERMINAL tab (gdb-server) for output from openocd
Launching server: "openocd" "-c" "gdb_port 50000" "-c" "tcl_port 50001" "-c" "telnet_port 50002" "-s" "/workspaces/eeg-device-firmware" "-f" "./openocd.cfg" "-c" "tpiu config internal :50003 uart off 8000000 2000000"
Launching GDB: "/usr/bin/gdb-multiarch" "-q" "--interpreter=mi2"
"/workspaces/eeg-device-firmware/target/thumbv7em-none-eabihf/debug/volks-fw"Set "showDevDebugOutput": true in your "launch.json" to see verbose GDB transactions here. Helpful to debug issues or report problems
Reading symbols from /workspaces/eeg-device-firmware/target/thumbv7em-none-eabihf/debug/volks-fw...
0x0000fe70 in core::ptr::const_ptr::{impl#0}::guaranteed_eq (self=0xff1b ::new+26>, other=0x0 ) at /rustc/f1edd0429582dd29cccacaf50fd134b05593bd9c/library/core/src/ptr/const_ptr.rs:423
423 /rustc/f1edd0429582dd29cccacaf50fd134b05593bd9c/library/core/src/ptr/const_ptr.rs: No such file or directory.
Program stopped, probably due to a reset and/or halt issued by debugger
target halted due to debug-request, current mode: Thread
xPSR: 0x01000000 pc: 0x00000100 msp: 0x20040000
target halted due to debug-request, current mode: Thread
xPSR: 0x01000000 pc: 0x00000100 msp: 0x20040000
Warning: the current language does not match this frame.
Note: automatically using hardware breakpoints for read-only addresses.
Temporary breakpoint 1, volks_fw::app::rtic_ext::main () at volks-fw/src/main.rs:8
8 #[rtic::app(device = hal::pac, peripherals = true, dispatchers = [SWI0_EGU0])]
Running Application
In the source code, file volks-fw/src/main.rs defines a USB device builder:
let usb_dev = UsbDeviceBuilder::new(usb_bus, UsbVidPid(0x16c0, 0x27dd))
.manufacturer("Volks EEG")
.product("Serial port")
.serial_number("TEST")
.device_class(USB_CLASS_CDC)
.max_packet_size_0(64) // (makes control transfers 8x faster)
.build();
Device Hunt lists this USB Vendor ID/Product ID pair as:
| Type
|
Vendor ID
|
Vendor Name
|
Device ID
|
Device Name
|
| USB
|
16C0
|
Van Ooijen Technical Informatics
|
27DD
|
CDC-ACM class devices (modems)
|
When the application runs, the device identifies itself as this:
sbranam@sbranam-HP-Laptop-14-dq0xxx:~/repos/eeg-device-firmware\$ lsusb
...
Bus 001 Device 048: ID 16c0:27dd Van Ooijen Technische Informatica CDC-ACM class devices (modems)
...
Running minicom on the device results in echoing any input:
sbranam@sbranam-HP-Laptop-14-dq0xxx:~\$ sudo minicom -D /dev/ttyACM0 -b 115200
Welcome to minicom 2.7.1
OPTIONS: I18n
Compiled on Dec 23 2019, 02:06:26.
Port /dev/ttyACM0, 14:43:35
Press CTRL-A Z for help on special keys
This is the echo!!!!
CTRL-A Z for help | 115200 8N1 | NOR | Minicom 2.7.1 | VT102 | Offline | ttyACM0
Test Modifications
I made the following modifications to add my username to the program output to prove signs of life end-to-end through the toolchain (see Dumb Embedded System Mistakes: Running The Wrong Code for why I do this).
Serial Output
This change adds the username to the serial echo output:
diff --git a/pc-communications-hal/src/pc_coms_hal.rs b/pc-communications-hal/src/pc_coms_hal.rs
index 82e5733..a24dc0c 100644
--- a/pc-communications-hal/src/pc_coms_hal.rs
+++ b/pc-communications-hal/src/pc_coms_hal.rs
@@ -250,6 +250,9 @@ impl PcInterfaceTrait for PcInterface {
/// add the passed data to the transmit buffer, to be sent out
/// as part of the background task
fn set_data_to_transmit(&mut self, data: [u8; 64], count: u8) {
+ for s in "\n\rsbranam echo: ".bytes() {
+ self.add_byte_to_tx_buffer(s);
+ }
// push all the data to the tx buffer
for b in data[0..count as usize].iter() {
self.add_byte_to_tx_buffer(*b);
Minicom output:
sbranam echo: a
sbranam echo: b
sbranam echo: c
sbranam echo: d
sbranam echo: e
sbranam echo: f
CTRL-A Z for help | 115200 8N1 | NOR | Minicom 2.7.1 | VT102 | Offline | ttyACM0
Semihosting Output
Semihosting sends output over the debugger connection to the host debug serial output, in this case over the J-Link to the OpenOCD terminal, via the hprintln! macro (see Semihosting - The Embedded Rust Book). This allows you to print debug messages without using the board's USB connection.
Changes:
diff --git a/volks-fw/Cargo.toml b/volks-fw/Cargo.toml
index dab3ec5..bc86d41 100644
--- a/volks-fw/Cargo.toml
+++ b/volks-fw/Cargo.toml
@@ -30,3 +30,4 @@ systick-monotonic = "0.1.0-rc.2"
nrf52840-pac = "0.10.1"
usb-device = "0.2.7"
usbd-serial = "0.1.0"
+cortex-m-semihosting = "0.3.3"
diff --git a/volks-fw/src/main.rs b/volks-fw/src/main.rs
index 17a9731..d1d6674 100644
--- a/volks-fw/src/main.rs
+++ b/volks-fw/src/main.rs
@@ -88,6 +88,7 @@ mod app {
#[idle(local = [pc_interface])]
fn idle(mut _ctx: idle::Context) -> ! {
+ use cortex_m_semihosting::hprintln;
// local copy of the pc interface
let pc = _ctx.local.pc_interface;
@@ -99,6 +100,7 @@ mod app {
// if there is data then transmit if back out
if rx.bytes_available > 0 {
+ hprintln!("sbranam echo: {}", rx.data_array[0] as char).unwrap();
pc.set_data_to_transmit(rx.data_array, rx.bytes_available);
}
}
To see the output, you first need to enable semihosting in OpenOCD, with the mon arm semihosting enable command in the DEBUG CONSOLE:
> mon arm semihosting enable
semihosting is enabled
If you forget to enable semihosting, the debugger will break at __c_m_sh_syscall@0x00003cee (Unknown Source:0). You can enable semihosting at that point and continue.
TERMINAL gdb-server output:
[2021-12-11T22:01:07.831Z] SERVER CONSOLE DEBUG: onBackendConnect: gdb-server session connected. You can switch to "DEBUG CONSOLE" to see GDB interactions.
Open On-Chip Debugger 0.11.0-rc2
Licensed under GNU GPL v2
For bug reports, read
http://openocd.org/doc/doxygen/bugs.html
Info : Listening on port 50003 for armv7m_trace connections
Info : Listening on port 50001 for tcl connections
Info : Listening on port 50002 for telnet connections
Info : J-Link EDU Mini V1 compiled Nov 2 2021 11:12:01
Info : Hardware version: 1.00
Info : VTarget = 3.290 V
Info : clock speed 1000 kHz
Info : SWD DPIDR 0x2ba01477
Info : nrf52.cpu: hardware has 6 breakpoints, 4 watchpoints
Info : starting gdb server for nrf52.cpu on 50000
Info : Listening on port 50000 for gdb connections
Info : accepting 'armv7m_trace' connection on tcp/50003
Info : accepting 'gdb' connection on tcp/50000
Info : nRF52840-xxAA(build code: D0) 1024kB Flash, 256kB RAM
undefined debug reason 8 - target needs reset
target halted due to debug-request, current mode: Thread
xPSR: 0x01000000 pc: 0x00000100 msp: 0x20040000
target halted due to debug-request, current mode: Thread
xPSR: 0x01000000 pc: 0x00000100 msp: 0x20040000
target halted due to debug-request, current mode: Thread
xPSR: 0x01000000 pc: 0x00000100 msp: 0x20040000
target halted due to debug-request, current mode: Thread
xPSR: 0x01000000 pc: 0x00000100 msp: 0x20040000
semihosting is enabled
sbranam echo: a
sbranam echo: b
sbranam echo: c
sbranam echo: d
You might also like... (promoted content)


