


Bit-Banged Async Serial Output And Disciplined Engineering
Contents:
- Introduction
- The Problem
- Symbol Framing
- Implementing Serial Output
- Working With A Logic Analyzer
- Working With A TTL-USB Serial Adapter
- Disciplined Engineering
- Conclusion
Introduction
Here I'll show you how to use a single GPIO line on an MCU as a serial output device, emulating the transmit side of a UART. This is useful for debugging in situations where you can't otherwise get data out of the system to see what it's doing.
This uses a technique known as bit-banging, where you toggle a line via software to implement the behavior that's normally built into a hardware peripheral. The software implements the same hardware signaling protocol as the peripheral.
This is useful when there are no other peripherals available on the MCU (because they've all been used for other things, they haven't been brought out in the board design, or they've been deliberately disabled for security purposes).
The code is in a GitHub repo, available for you to use. See the Implementing Serial Output section for retrieving it.
I've also taken this opportunity to provide more than just the source code, treating it as an example of applying disciplined engineering. Discipline takes more time in the short term, but saves time and trouble in the long term. It's an investment, with significant return on investment over the life of a package, from its initial development through its use in fielded end products for years.
The Problem
My preferred method for debugging embedded systems is to fire up a debugger and examine things directly. But sometimes that's impractical, particularly if there are timing dependencies, or the system transitions between images, disrupting the debug context.
Three situations in particular tend to be problematic:
- Multi-MCU designs where another MCU is expecting this MCU to respond within specific timeframes.
- Bootloaders, where the bootloader jumps to the application image or another bootloader stage, or the application resets to the bootloader.
- The MCU is buried deep in the hardware design, with no provision for debugger access.
In the first case, halting execution and examining things at human timescales (seconds to minutes) can't be done because the other MCU is expecting things to happen at machine timescales (microseconds to milliseconds); similarly with multi-threaded, timer-driven, or other interrupt-driven designs. In the second case, the debugger knows about the image being debugged, but not about the image being jumped to. The third case might be on a production board design where debugger access has been removed as a security precaution, but it does have provisions for internal bootloading so that it's still programmable.
If the MCU has serial or other logging available, that's the other main option, affectionately known as "printf debugging". That can still have timing issues due to excessive logging, but at least the logging is at machine speed. You can instrument the logging to print the relevant data you need for debugging.
But logging may not be available. The logging library may not be available in a particular build, or there may not be a UART available (again, the serial path may have been removed for security, or was simply left out of the board design).
Now there's no way to get information out of the MCU. What can we do?
If you have one or more spare GPIO's available, or can temporarily take them over, bit-banging data out for capture with a logic analyzer is the next choice. Low-cost USB-connected logic analyzers make this very practical.
The simplest data output is to toggle a GPIO serially in some pattern, or toggle multiple GPIO's in parallel for a multi-bit pattern. You can capture the traces with a logic analyzer and manually decode them.
Manual decoding can be tedious, time-consuming, and error-prone, but this method has the real advantage that it can be used when there are tight timing dependencies, since just doing a few GPIO toggles executes quickly. I've used this to signal 2- or 3-bit values at interesting points in the code.
But once the amount of data you need to capture starts to get more involved, the challenges of manual decoding start to exceed the benefit.
You could implement a custom protocol decoder in the analyzer, but why not take advantage of the built-in protocol decoders? Particularly if your timing dependencies can tolerate the delay of longer toggle sequences.
Let's use the tried and true asynchronous serial protocol used in UARTs and RS-232, with 8-bit data, no parity, 1 stop bit, commonly referred to as 8N1. This is a dead-simple protocol that's supported by a wide range of devices, so once you get the timing tuned with a logic analyzer or oscilloscope, you can connect it to other things that support TTL UART, for instance serial-to-USB adapters.
Note that while RS-232 uses the same protocol signaling, it uses inverse logic levels and higher voltage (from -15 V to 15 V). UARTs and GPIO toggling use TTL voltages. A common mistake is to connect a cable between an RS-232 device and a TTL UART and expect them to be able to communicate. This requires an RS-232-to-TTL-UART adapter.
Symbol Framing
The important thing that a protocol provides is symbol framing. When you're just toggling bits, it can be tricky to figure out where the data boundaries are, where a unit of data starts and where it ends in a trace. All those pulses in a trace run together, making it error prone to decode.
Symbol framing specifies what the line does between data units (its idle pattern), where the units start and end, and what constitutes data bits. Given a protocol specification, the logic analyzer software can process a trace automatically to decode it. It can be thrown off by framing errors, violations of the protocol in the signal trace, but can usually recover.
There are many protocols using one or more wires. They can get quite complex in order to be robust in the face of transmission errors caused by bugs, poor hardware, poor signal integrity, signal interference, or challenging environments (like in a spacecraft subject to cosmic rays and solar storms, or an industrial system in a noisy electrical environment). This is important when communications need to be highly reliable.
But async serial 8N1 is a very simple protocol, suitable for friendly environments over short distances. It's perfectly adequate for a 2-wire jumper setup (transmit data and ground, TX and GND) over a few inches, or a 2-wire cable over a few feet, all running at your desk or lab bench.
In serial 8N1, the line idles at high, and 8-bit data units (bytes of data) are framed by a start bit at low and 1 stop bit at high. Thus there are two bit-times of framing overhead, requiring a total of 10 bit-times on the wire. A bit time is the amount of time the line must be high or low in order to signal one bit of overhead or data. This is defined by the baud rate, the rate at which the line signals bits. One bit-time is equal to 1/baud-rate.
The symbol rate is the rate at which independent symbols are transmitted on the line, accounting for overhead. A common baud rate is 9600 bps (bits per second). Since 8N1 is 10-bit times per symbol, the symbol rate would be 960 bytes per second. The bit time is 1/9600, or 104.2 usec. The symbol time is 10/9600, or 1.042 msec.
Universally, baud rate and protocol name are the general terms people use. So 9600 8N1 is a full protocol specification.
Implementing Serial Output
I've gone through several iterations of this over the years, but this time I've followed a TDD process and provide both the test code and the production code. Then you can use both directly in your projects.
Since we're only doing the transmit side, it's pretty simple stuff. The receive side is much more complex because of the need to do sampling and interpretation, but we're relying on external devices for that.
This doesn't use external code, interrupts, DMA, timers, UART, or any other peripherals other than a single GPIO, so it imposes minimal demands on system resources other than CPU time. That makes it usable in all kinds of contexts and situations where more complex setup might be problematic. If you can get your MCU to the point where you can wiggle one GPIO output pin, you can use this.
The module is called BBSerialTx, and is on GitHub at BBSerialTx. You can clone the repo or download it as a zip. It includes full Doxygen-generated documentation (navigate to documents/html/index.html in your copy once you've retrieved it from GitHub) and the off-target test suite resulting from the TDD process, as well as test results and analysis (navigate to analysis and analysis/lcov/index.html). You can use the code directly on a target MCU, or customize it. It includes an example running on an Arduino-compatible Elegoo MEGA2560 R3 board. If you do any customization, you can regenerate the documentation and test output for your version (see the Build and Test section of the documentation).
Every time I do this, it comes out a little differently. The main difference this time is that I've generalized it more. It uses a GPIO write function that you provide to do the physical output, and I added a couple of additional formatted output functions.
One thing you'll need to do is calibrate BBSerialTx to your specific board. This requires a logic analyzer or oscilloscope to obtain precise timing measurements. Once you've done that, you can connect directly to a TTL serial device.
Working With A Logic Analyzer
I used a Saleae logic analyzer to capture the output of the Arduino example running on the Elegoo R3 board. The downloadable software for the analyzer includes a number of protocol analyzers for decoding acquired raw signal traces. This is a great, easy-to-use logic analyzer.
Other logic analyzers should work as well. You can also use an oscilloscope to do the calibration measurement.
I also used PCBite probes. The Elegoo R3 is development board, so it has pin headers for all its GPIO's, but I wanted to show how you can reach arbitrary points on any board, whether a development board or a production board. You can place them on test points or component leads or solder pads.
These probes are fantastic, because they allow you to probe a board without having to solder on test leads. My soldering skills are limited, so I risk damaging a board every time I have to do that. If it's a limited-run prototype board with hard-to-find parts, that can really raise the stakes. The probes avoid all that, so are a must-have investment.
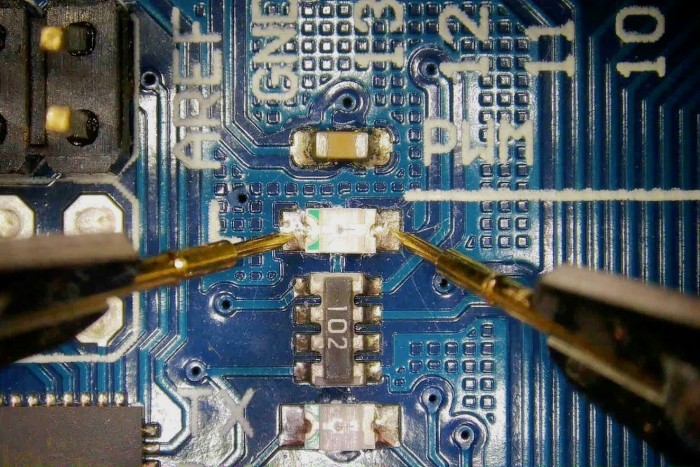
This is the hardware setup, probing the yellow built-in LED on the board on GPIO pin 13. The probes tips are sitting directly on the LED solder pads, for GND and TXD (Transmit Data). The probes include a magnetic base plate, magnetic probe bases, and magnetic board holders (the reflective surface of the plate allows you to see the underside of the board as you're setting up the holders). Those heavy black curved things are the flexible probe arms. The magnets hold everything in place, while the weighted probe heads hanging from the arms apply just enough force to hold the pins on the board.
_15206.jpg)
Closeup showing the probe tips on the LED:
_48348.jpg)
LED off so you can see things clearly:
_79094.jpg)
Closeup through a TOMLOV digital microscope so you can see the pads:
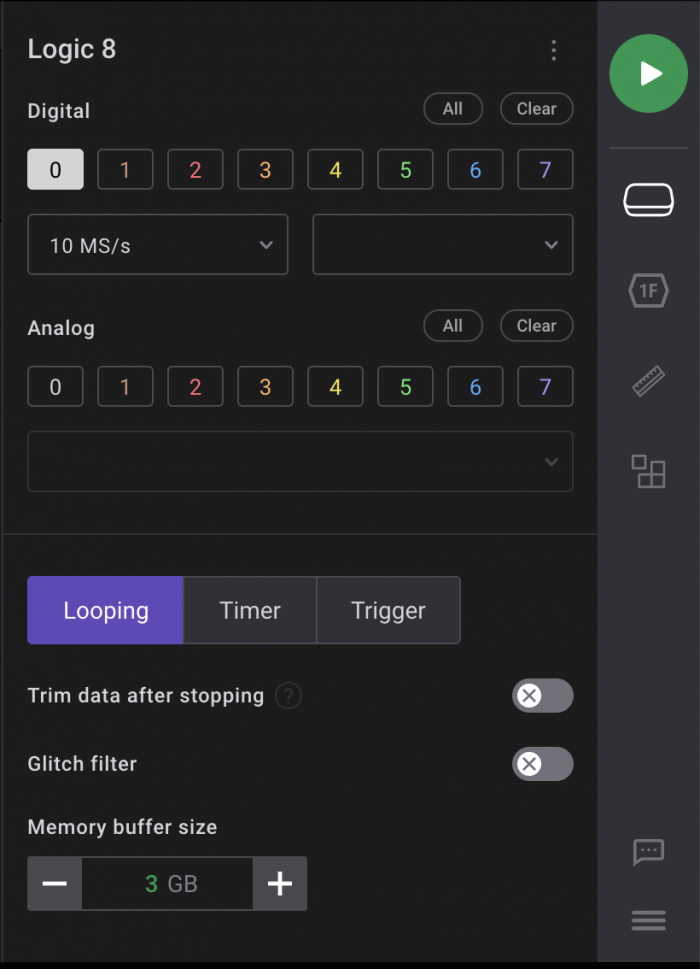
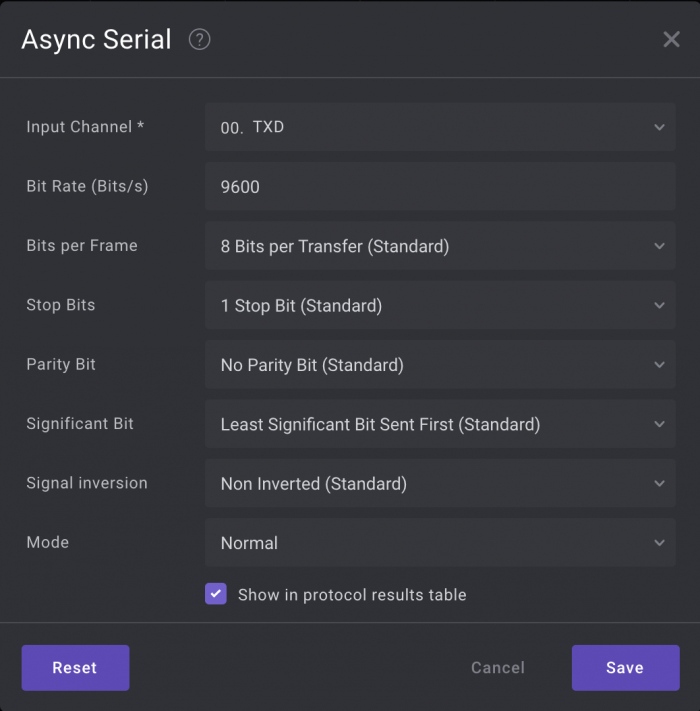
Here's the Saleae setup for TXD (GPIO pin 13):
The Arduino example includes these lines for calibration:
#define NEEDS_CALIBRATION 0

const BBSerialTx_BaudRate_t  baud_rate = 9600;
const BBSerialTx_WriteNsec_t calibrated_nsec_per_write = 7100;
The value 7100 for calibrated_nsec_per_write is based on setting NEEDS_CALIBRATION to 1 and running it on my R3 board. I captured the calibration pattern on my analyzer and measured it, then tweaked the resulting value to adjust it for good data.
It might surprise you to learn the that the R3 is not an extremely fast board. It has a 16 MHz crystal on it, that silver can marked "16.000" near the LED:
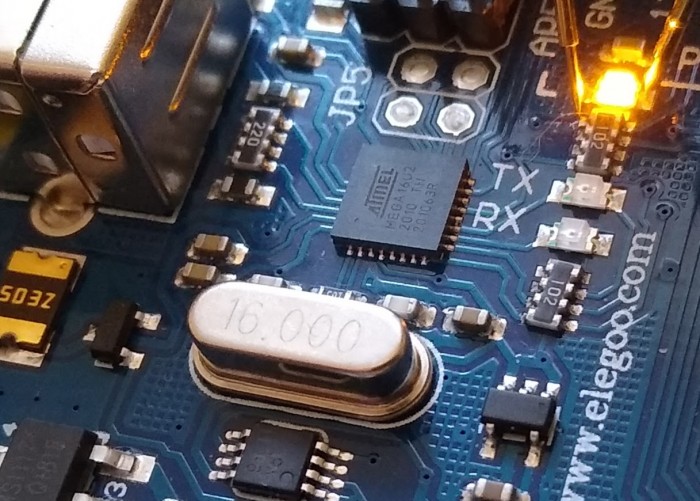
That means the time to write a bit is relatively long compared to other board designs with faster MCU's; you might end up with a significantly lower calibration value. Further, it means I can't use a high data rate like 115200 baud. So I've used 9600 baud. Even then, the timing isn't perfect, as you'll see below, but it's good enough. A faster MCU with shorter write time means more precise calibration is possible.
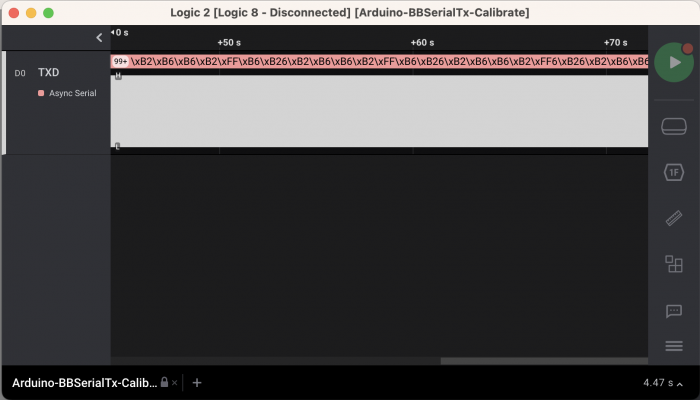
Running the analyzer, this is the captured calibration pattern, zoomed out fully (ignore the pink data values, because this isn't sending out a valid 8N1 pattern yet):
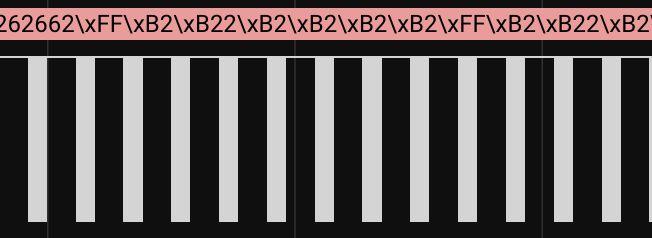
Zooming, you can see an alternating bar pattern:
Zooming in on a bar, you can see an alternating bit pattern:
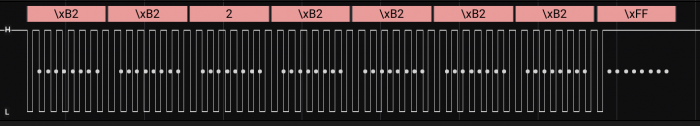
This is what we need to measure. Add a timing marker to the very first and last toggles in the bit pattern:
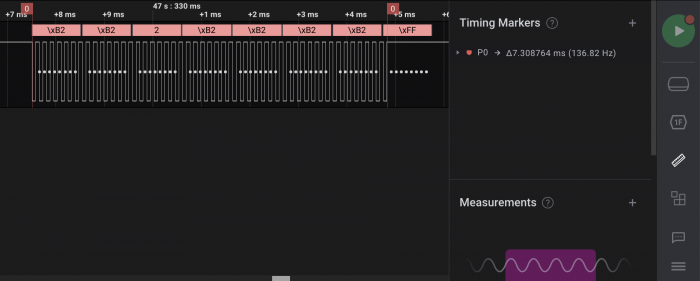
7.308764 msec / 1000 writes = 7.308764 usec/write
7.308764 usec/write * 1000 nsec/usec = 7308.764 nsec/write
Given 1000 writes, the units conversion simply means multiplying the measurement by 1000 and calling it nsec instead of msec. Then round it to the nearest integer value.
That gives 7309 nsec/write. Experimentation with the analyzer showed that 7100 gave better timing of the output, where the analyzer trace showed captured bit times centered better on the theoretical bit times, shown later. Not perfect in the analog world measured to six decimal places, but good enough in the digital world.
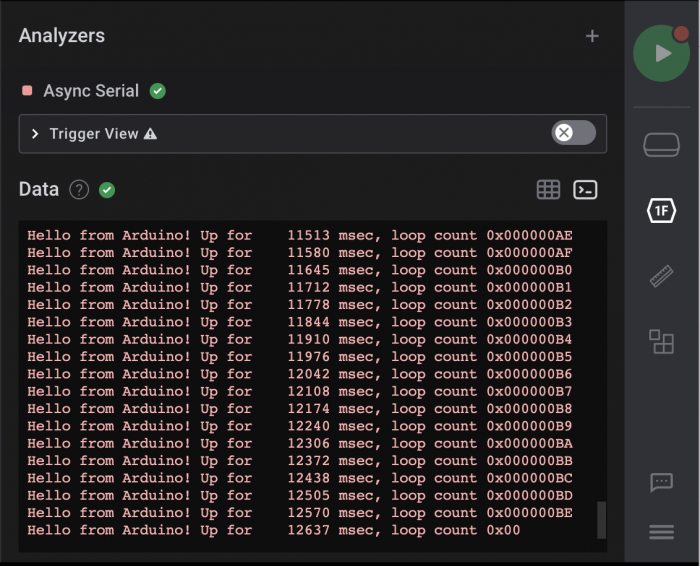
With a suitable calibration value set and NEEDS_CALIBRATION set to 0, the Arduino example outputs this line in its loop:
Hello from Arduino! Up for XXXXXXXX msec, loop count 0xXXXXXXXX
That's the data I expect to see on the analyzer once it interprets the captured TXD signal.
Here's a capture of the data (Success! That always feels good when the hardware agrees with the software!):
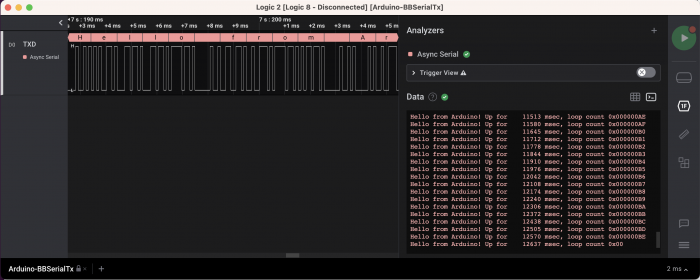
This is the analyzer terminal view:
And the signal trace view, interpreting the data as ASCII:
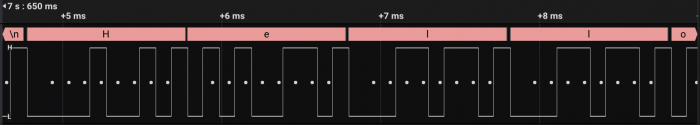
That same data interpreted as raw hexadecimal:
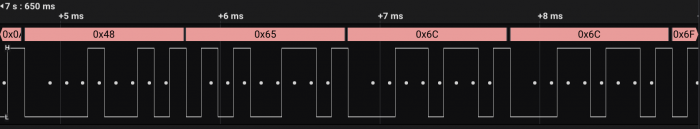
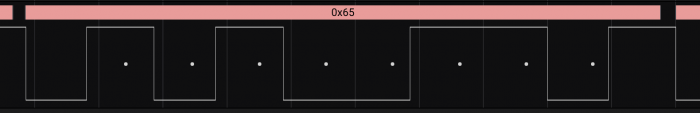
Zooming in the 0x65 byte, we can see a few interesting things:
- The white dots are the data bits, encapsulated in the low start bit at the front and the high stop bit at the end.
- The data bit pattern reading left to right is 1010 0110 but is interpreted as the value 0110 0101, because the bits are sent in LSB-MSB (Least Significant Bit to Most Significant Bit) order.
- Notice how the white dots are closer to the center at the beginning than at the end; that's the bit-time centering. My calibration isn't perfect, so the bit timing is a little off. It's close enough that the analyzer can interpret it based on its sampling algorithm even as the timing drifts over 8 bit times. The start bit of each symbol resynchronizes it, so it never drifts too far.
The last interesting observation is that the yellow LED isn't as bright as normal, because it isn't on 100% of the time. The bit pattern being sent to it is acting like a PWM (Pulse Width Modulation) signal, turning it on and off rapidly. If you count up the number of 1's vs. 0's, it's on roughly 50% of the time, so appears to the human eye about 50% bright.
You could actually point a camera at the LED and capture the on/off pattern of the light to receive the data via image processing. So this also functions as an optical data transmission system.
Working With A TTL-USB Serial Adapter
Once I had calibrated and proved this out with the logic analyzer, I replaced the analyzer with a TTL-USB serial adapter. I used an Adafruit adapter. Many similar adapters are available, such as this one using a CH340C chip, or this one using an FTDI chip.
TTL serial is not RS-232! If you want to connect this to an RS-232 receiver, you'll need an RS-232 TTL converter. See this tutorial for an explanation.
I connected the adapter to the PCBite probes (GND to GND, and adapter RX to my R3 board TXD GPIO pin 13) and a USB extension cable to my laptop:
_62504.jpg)
Then I ran the minicom terminal emulator on my laptop:
minicom -D /dev/ttyUSB0 -b 9600
That gave me the output I had seen in the analyzer terminal view:
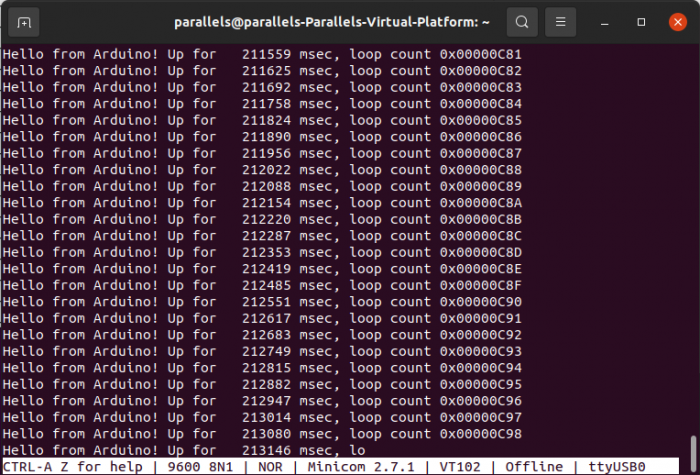
This gave me hard evidence that it was working. I always like to be able cross-correlate results obtained in different ways to verify things, especially across software-hardware interactions. Here, the off-target test suite results agreed with the logic analyzer results which agreed with the serial adapter results.
That's part of disciplined engineering. Don't just tell me, prove it!
Disciplined Engineering
You can use the example of BBSerialTx as a starter template for your own modules. I've built a set of example tool usages into it. You can replicate that directly for your own modules, or expand on it. It's just a small, simple module, but everything can be scaled up to larger, more complex modules and projects.
"Disciplined engineering" means I'm not just throwing out some obscure code with minimal information for you to puzzle through. I'm going through the kind of additional work that's required when doing real product development. That's how you should work on a real project team, where you've got other people who need to understand what's going on.
Over the years that the project is supported, multiple people will come and go. They'll have varying levels of education, experience, and skills, from the total newbie learning as they go, to the senior engineer. And no matter their background, there's always the possibility that it doesn't include some aspect of the project that's new to them.
By following disciplined engineering practices, all of those people will be able to work with the code, either as users of it or as developers extending or fixing it. They'll be able to work safely, not breaking things.
Disciplined engineering takes extra time to create a tested, documented, robust codebase. That helps it remain so over the life of the product, from first release at V1.0 to V12.0 years later, no matter who works on it. Successful products live for a long time.
This may not be appropriate for a quick proof-of-concept project. But for anything that you expect to productize, anything you expect to release into the world as a long-lived product, you should do it.
For me, disciplined engineering means providing the following:
- Readable, maintainable code.
- Documentation.
- Tests.
- Analysis.
- Automation to make the build, test, documentation, and analysis steps easy.
- All managed in a version control system.
We may disagree on the specifics, the tools to use, and how to apply them. Find a good set that works for you, for your company or work environment, for the consumers of your code. If you want to be considered a professional, or a professional organization, you need to work in a disciplined manner.
These are the tools I've used in BBSerialTx:
- My post Six Software Design Tools.
- Git for version control (GitHub is just one of several cloud services that support git).
- Google Test for the test suite.
- TDD (Test-Driven Development) using a BDD (Behavior-Driven Development) style for the test suite.
- Gcov and Lcov for test coverage analysis.
- Pmccabe for MCC analysis.
- Doxygen for the documentation.
- PlantUML for embedded UML and Ditaa diagrams in the Doxygen-generated documents.
- CMake for the build system.
- Bash scripts for additional automation.
One of the benefits of bundling everything in the repo is that when you make a change to the code, you can make appropriate accompanying changes to the tests, documentation, and automation as a complete package in the PR (Pull Request). That can be part of the code review checklist as part of the disciplined engineering.
Applying Six Software Design Tools
TDD (Test Driven Development)
TDD is the main driver for applying the other tools. I always feel that the best code I've ever written comes out of the TDD process. It absolutely makes me a better software engineer.
One of the main advantages of TDD is that it provides instant feedback of problems. It weaves a safety net that allows you to charge headlong into the code and know instantly when something goes wrong.
As I worked, having an evolving test suite allowed me to quickly change things and verify that my changes were good. That's part of the refactoring aspect of TDD: not just cleaning up after implementing the code to make a single test pass, but wholesale changes that rearrange the overall implementation of the code while preserving its behavior.
Even on something as small and simple as BBSerialTx, that I've implemented several times before, I made changes to rearrange things as I worked. Having the test suite allowed me to charge on with those refinements with the confidence that I wasn't breaking what I had. There were short-term breakages, that the test suite exposed so that I could immediately fix them.
I used a BDD structure for the tests, using the "Given, should, when" pattern:
- Given a set of initial conditions,
- the code should behave in an expected way
- when the API is used in a specific way.
By naming the tests with this same pattern, they become a human-readable specification for the module. So the analysis step processes the test suite output to generate a specification document. Then anyone, including non-technical stakeholders, can read the document and say, "It should also do this behavior." The specification and the tests form a mutual feedback loop. In that way, the TDD method drives larger development changes.
This is the specification that resulted from my initial ideas and what evolved over the course of the TDD-based development:
- PASSED: Given UnopenedBBSerialTx, Should NotOpen When NullFunctionPointer
- PASSED: Given UnopenedBBSerialTx, Should Open When NonNullFunctionPointer
- PASSED: Given UnopenedBBSerialTx, Should NotWriteBit
- PASSED: Given UnopenedBBSerialTx, Should WriteIdle When Open
- PASSED: Given OpenBBSerialTx, Should NotWriteData When Closed
- PASSED: Given OpenBBSerialTx, Should WriteTestPattern When Calibrating
- PASSED: Given OpenBBSerialTx, Should WriteStartAndStopBits When WritingByte
- PASSED: Given OpenBBSerialTx, Should WriteBinaryData When WritingByte
- PASSED: Given OpenBBSerialTx, Should WriteCharData When WritingString
- PASSED: Given OpenBBSerialTx, Should WriteTrailingSpaces When WritingString
- PASSED: Given OpenBBSerialTx, Should WriteAsciiHexData When WritingUint8
- PASSED: Given OpenBBSerialTx, Should WriteAsciiHexData When WritingUint16
- PASSED: Given OpenBBSerialTx, Should WriteAsciiHexData When WritingUint32
- PASSED: Given OpenBBSerialTx, Should WriteLeadingZeroes When WritingUint32
- PASSED: Given OpenBBSerialTx, Should WriteAsciiDecimalData When WritingDecimal
- PASSED: Given OpenBBSerialTx, Should WriteMinusSign When WritingNegativeDecimal
- PASSED: Given OpenBBSerialTx, Should WriteAsciiZero When WritingZeroDecimal
- PASSED: Given OpenBBSerialTx, Should WriteLeadingSpaces When WritingDecimal
- PASSED: Given OpenBBSerialTx, Should WriteLeadingSpacesAndMinusSign When WritingNegativeDecimal
In Google Test, I use each test fixture to establish the "Given" conditions for a group of tests that apply under those conditions. Then the individual tests do whatever steps are necessary to expand on those conditions for the particular test case, set the expectation for the test, and perform the behavior under test.
Each test is very short and simple, testing just one specific behavior.
BBSerialTx just needs two test fixtures, but a more complex module might have a more complex set of system states, each one requiring its own fixture and set of tests. The setup function for a fixture does whatever steps are necessary to drive the system into the desired "Given" state, and the teardown function clears it so that it doesn't affect subsequent tests.
Making the code testable in this way drives the overall design and fleshes out the API.
The test suite uses a spy test double to capture the write function output. Then the test assertions call helper functions that retrieve the captured data. This is a very effective method for working with hardware dependencies on embedded systems.
For more on TDD, see my previous posts:
- Review: Test Driven Development for Embedded C, James W. Grenning. This is the canonical reference for embedded systems TDD, where I learned the spy method.
- Unit Testing For Embedded Software Development
- Acceptance Tests vs. TDD
The video that really sold me on BDD was Kevlin Henney's Structure and Interpretation of Test Cases. It's long, but it's really worth watching (watchable at 1.5 or 2x). I used the "given, should, when" form based on other things I've seen rather than the "given, when, then" form, but they achieve the same thing. Choose the form you like better; a quick online search shows that the second form appears to be preferred.
API (Application Programming Interface)
The API literally identifies the code's interface to the rest of the world. TDD allows you to start with whatever degree of vague or specific idea of the API you want, then expand and refine it as you go.
In this case, I had a fairly complete initial idea of the API I wanted BBSerialTx to provide, since I've implemented versions of it before. Over the course of developing it, I expanded that to add additional behavior.
There's also another concept of API at play: what API's does the code under development need to work with? By expanding the meaning of API to hardware as well as code, it's clear that the 8N1 protocol is a hardware API.
Thus there are two API's associated with BBSerialTx:
- It provides its own API to callers.
- It must implement the externally defined 8N1 "hardware API".
A more complex module might itself use the API's provided by other components, completing the set of API patterns: provides, implements, and uses.
Any given project will have a number of such API associations (both hardware and software API's). By thinking of the these API's as abstract composable elements, you can think about the system design at a higher level. That keeps you out of the weeds of functions and parameters, deferring those details until later.
DAMP (Descriptive And Meaningful Phrases)
I've used DAMP names for identifiers throughout, even for the tests. Then I've provided additional information in the comments for Doxygen. The DAMP names allow me to keep the comments short and direct. Then when I refer to things, their names are reminders of the purpose and usage of each item.
Having the support of the TDD suite means I can rename things as much as I want, playing around with the names until I'm satisfied they capture the concepts well. That's another thing that evolved as I worked.
DRY (Don't Repeat Yourself)
Again, having the protection of the TDD suite means I can refactor things mercilessly to consolidate repeated code. This trims it down tight.
This not only gathers repetitions of the same concept, it also helps keep separate concepts apart even if they happen to look the same purely by coincidence. For instance, the constant 2 could appear in two places, but could represent the different concepts NUMBER_NYBBLES_PER_BYTE and MAX_NUMBER_RETRIES.
MCC (McCabe Cyclomatic Complexity)
I strive to keep the MCC value under 10 for each function. That keeps them simple and modular, which makes them easy to test. From these known-good simple building blocks, I can build larger blocks that are themselves simple, modular, and testable, in a layered fashion.
SOLID (SRP, OSP, LSP, ISP, DIP)
The SOLID principles don't just work in Object-Oriented languages like C++, they apply just as well in C, because they are design principles, not language principles; they're language-agnostic. You just don't have the compiler support and enforcement.
In particular, I've applied these here:
- SRP (Single-Responsibility Principle): each function handles a single thing (even the test functions), keeping them short and modular.
- LSP (Liskov Substitution Principle): the write function supplied to the module allows any write function to be substituted, which not only generalizes it to any hardware platform, but also makes it testable off-target.
- DIP (Dependency Inversion Principle): making the write function a parameter inverts the dependency on the hardware write interface. It's an example of dependency injection, where the write dependency is injected into the module by the caller rather than built into it.
Documentation
It's always a judgement call how much to do. What's the right amount and the right level of detail? What things are appropriate? The main point is that zero is not the right answer.
The guideline I use is to think about the people coming along in the future who will need to know, today, next month, or years from now.
- What would help them get onboard and productive faster?
- What workflows do they need to know?
- What architectural and internal details do they need to know?
- What new terms and concepts are there?
- What theory of operation should they know?
- What frequent questions might they have?
- What will kickstart them on the way to being able to figure out the rest themselves?
I expect that they will be smart, capable people. But I want to point them in the right direction and enable them.
There are a variety of documentation tools. Here I've used Doxygen, because it's a lightweight tool that allows me to generate formatted documentation directly from the source code, as well as provide additional information in the main page.
It integrates well with PlantUML for creating diagrams. This is very powerful, because good diagrams can convey a lot of information succinctly. You can create structured UML diagrams and free-form DITAA diagrams with color (see my post DITAA Color Codes For Diagrams for a downloadable color chart).
Other good lightweight tools are AsciiDoctor (see my post Documenting System Architecture With AsciiDoctor) and the Readme markdown file provided by systems like GitHub. Like Doxygen, these allow you to bundle all the documentation in-repo right with the code.
I've provided a very minimal Readme here, since the Doxygen documents are meant to be a standalone set.
Automation
CMake provides the build automation, supplemented by bash scripts. CMake is my weakest skill area here. I've provided enough of it to do local builds of the test suite for off-target testing, to enable TDD. What I haven't provided is target MCU cross-builds. For that you'll need to pull BBSerialTx into your specific cross-build environment.
The CMake configuration does 3 things:
- Configures building BBSerialTx as a static library.
- Configures building the test suite as an executable using the library.
- Configures Doxygen.
In the scripts directory, there's a script to analyze the source and built image. This performs static analysis of the code for MCC complexity analysis, then runs the image (built with gcov instrumentation) to perform gcov and lcov test coverage analysis.
You can expand this as desired to include other analysis tools and steps appropriate for your environment, such as MISRA linting, stack consumption, Valgrind memory checking and profiling, etc. The key is to make it one-step-easy to do.
Test Coverage
MCC and test coverage serve as feedback control mechanisms, providing important safety checks on the code base. Along with tests, they are the feedback control signals.
As long as they remain within acceptable range, you can have confidence that the code is meeting the requirements of disciplined engineering.
When they depart from that range, you know there's a problem, just as clearly as if a test failed. Then they give you the data to locate and correct the problem.
Test coverage can be a bit controversial (see for instance this excellent summary: Code Coverage Complications). While 100% test coverage is a laudable goal, making it an arbitrary requirement without backing it up by a disciplined process risks having poor, ineffective tests, or spending excessive time trying to meet the requirement with diminishing returns.
It also risks allowing a bloated, poor quality codebase. High test coverage doesn't necessarily mean high quality code.
Once again, TDD wins the day, especially when guided by BDD. Every line of code is the result of having some test of some desired behavioral aspect. If it's not covered by a test, it shouldn't be there. If it isn't part of satisfying some specific behavior, it shouldn't be there.
TDD-based code typically has very high code coverage, often 100%. The tests are high quality and effective, focused on actual behavioral goals of the code. The code itself has only as much code as needed to pass those test and implement those behaviors. It is lean and focused, avoiding bloat.
As always, avoid brittle tests by testing to interface and behavior, not testing to implementation. That way the underlying implementation of the behavior can be changed, and the tests remain valid, they don't need to be changed.
Conclusion
BBSerialTx offers an easy way to get information out of a system when other options have been exhausted, and is a good tool to have in your toolbox.
Use disciplined engineering for anything that's going to survive longer than a quick proof-of-concept. That investment will provide many years of valuable returns.


- Comments
- Write a Comment Select to add a comment
To post reply to a comment, click on the 'reply' button attached to each comment. To post a new comment (not a reply to a comment) check out the 'Write a Comment' tab at the top of the comments.
Please login (on the right) if you already have an account on this platform.
Otherwise, please use this form to register (free) an join one of the largest online community for Electrical/Embedded/DSP/FPGA/ML engineers:


