


Simple Automated Log Processing
Text log data offers a wealth of information from an embedded system. At least during prototyping and development phases, most systems have some kind of serial log output, or use semihosting methods to log to a serial output channel in a debugger. Then you can capture the logs to a file.
The problem is that they tend to accumulate large volumes of data. Logs can be many thousands of lines long, especially when you run long duration tests. Finding information and evaluating trends in the logged values is hard. The signal gets lost in the noise.
Scripting Skills
I've been surprised when people have expressed admiration for my scripting skills. They're really pretty basic. But I guess bash scripting isn't common among embedded developers. I tend to do things in the simplest possible manner, based on the quickest possible solution (quickest in terms of finding a solution that works, not in terms of execution speed).
One nice thing about shell scripting for this kind of task is that performance and efficiency are largely irrelevant.There's no need to obsess over the perfect algorithm or resource utilization. This is an example of perfect being the enemy of good. You're writing a script that's going to be run outside of a critical operating environment, with virtually infinite memory and storage and cycles to spare, used infrequently, and usually completes in seconds.
Whatever works, works. If the method you use is a big crude hammer that's laughable to someone who knows better methods, it doesn't matter, as long as it gets the job done. You just need results NOW, so do it. You can always come back later and tweak it with better methods as you learn them, if you still need the script.
But once you get into the habit, the scripts get better. The skills make you more effective. And maybe that justifies the admiration. Having learned a basic pattern, you can toss off a needed script quickly, and get on with your work.
There are lots of tutorials, cheat sheets, and manuals available. Once I've gotten basic training from a tutorial or two, I find cheat sheets the most useful, because I'm usually trying to remember the obscure syntax of some particular operation, and a quick reminder is sufficient. The manuals are the backup reference.
- Bash scripting cheatsheet: My goto for bash.
- Bash Guide for Beginners: A thorough tutorial on bash.
- Advanced Bash-Scripting Guide: Another thorough tutorial.
- Bash Reference Manual: The GNU bash manual.
- Sed - An Introduction and Tutorial by Bruce Barnett: A nice tutorial covering a lot of usages.
- sed, a stream editor: The GNU sed manual.
- Grep - An introduction to grep and egrep. How to search for strings inside of files.: Barnett's tutorial on grep.
- A Beginner’s Guide To Grep: Basics And Regular Expressions: A nice tutorial covering a lot of usages.
- Ryans Tutorials: grep: grep cheatsheet.
- GNU Grep 3.4: The GNU grep manual.
- Linux Commands Cheat Sheet: If you're new to Linux, this is a general list of commands that can be used in scripts.
Automation
Reading or searching through megabytes of logs manually is impractical. Automation is the answer.
To automate this, you need text processing tools. One of my favorites is the Linux command-line environment, the bash shell and all the command-line tools. One of the great concepts of Unix was that it was a tool-based system, and you build other tools out of combinations of tools.
If you're using a Mac, you already have this same environment. If you're using Windows, you can get it with either Git Bash for Windows, or MSYS2; both are derived from MINGW.
For Windows, might as well go with the full MSYS2, even if you've already installed Git Bash. Then you can install GCC and all the development tools, which you can use with Google Test to create off-target unit tests for your embedded system code, which then allow you to do Test Driven Development, which then allows you to significantly reduce your on-target debugging. That's a topic for another post.
Python and Perl are also effective. It's largely a matter of personal preference, and which languages and tools you're most familiar with. I like to be familiar with as many different ones as possible for versatility.
Here I'm using bash scripting. In this particular case, I was monitoring heap usage. The device was logging through a semihosted debug interface, reporting heap statistics every second. That's 3600 lines every hour, over 10,000 lines in 3 hours, mixed in with all the other logging. I wanted to be able to graph consumption over a long period, where an hourly reading was sufficient.
Your log data may be different, and you may be looking for different things. Use this as an example of some of the methods for building what you need from the available tool elements.
Log Data
This is the format of a raw log line for my example (this is data collected from a real device, modified for public viewing). Scroll sideways to see it in all its glory:
20:34:08.719 Debug [ frammulator.c 203] heap profile data total_bytes = 3112960 used_bytes = 1384827 heap_used_bytes = 1432904 free_memory_bytes = 1680056 max_used = 1452360 max_request = 64640 0x810005C0003f1234567890abcdef1a2b3c4d5e6f1234567891234567890abcdef1a2b3c4d5e6f123456789
This is a fairly typical general logging format. The line contains a timestamp (this device has an RTC (Real-Time Clock), so the timestamp shows true GMT time), a log level identifier, a source code line reference, and then the log message.
This particular debugger also exports a trailer of hex data with the text; in real data, it contains the hex values of the bytes of the log record. I'm not sure what the intended utility of that is, but it represents one of the things you have to deal with: excess text that just gets in the way of readability.
One other thing about log data is that it's often split over multiple files as it's being captured. That allows data management at file granularity. Rather than logging continuously to a single file that grows to gigabytes, possibly filling up the storage system and being too large for some tools to handle, it's better to cut the file off at some point and start a new one. Then you can delete old log files that are no longer useful, while retaining the newer ones.
This type of log rotation may be manual, or it may be automated, depending on the tools ingesting the log data. You end up with an ordered set of files, not just one single file. The file naming convention indicates the order of the data, and might consist of a timestamp or a simple sequence number. A root filename pattern with a wildcard matches to the set of files.
Viewing one of these log files in this raw form is difficult. There's just too much text (remember that in addition to the long lines resulting from the trailer data, there are other log lines as well). It needs to be filtered down to just the target lines of interest from the set of files, and those lines need to be stripped down to a manageable length.
The other thing is to digest the information from the thousands of one-per-second lines of heap statistics down to some meaningful summary. Just what constitutes a useful summary depends on the type of data, and what you're trying to understand from it.
In this case, I was trying to tell if there was a long-term memory leak. That would imply a monotonically-increasing heap consumption. Normal behavior of this particular application would be brief increases, returning to the previous level when work was done and the system returned to idle for 60 seconds, repeating this cycle forever. There might be some initial increases due to sbrk activity to expand the heap arena, but then it should stabilize. There should be no cumulative growth.
For this kind of data, all I needed was a simple sampling strategy. Since the test ran overnight for about 8 hours, getting the hourly sample would be sufficient to show me a reasonable graph.
Of course, I could just look at the starting and ending values for the heap statistics for a quick answer, but a graph would give a more nuanced answer, to see if there was any variation in the consumption pattern. Because part of the answer to chasing down the memory leak might depend on that, possibly correlating changes in rate to other system activities or external conditions (after all, this is an embedded system, that has to deal with the vagaries of the real world).
I could also select a more frequent sample rate, such as every half-hour, every 10 minutes, or every minute. Such finer granularity sampling might reveal some interesting excursions in the data that were groomed out at lower frequency (yes, we're doing signal processing of text logs!). That's one of the tuning parameters you have in such investigations.
The Script
The script I wrote does this one kind of analysis on this specific data and nothing more, but it serves as a general pattern example for an entire class of analyses.
You could easily parameterize it for the target string to search for, the frequency of the samples, the length of the header, the format of the trailer, and the data fields to be graphed. Then you could wrap that in simple functions that called the main script with the right set of parameters for your data.
Once you have the data digested to a CSV, you can import it into other tools such as spreadsheets or more sophisticated analsysis packages, and then do all kinds of analysis on it.
There are many ways to code scripts. I use the DAMP and DRY principles to guide my coding:
- DAMP: Descriptive And Meaningful Phrases to name functions and variables.
- DRY: Don't Repeat Yourself, just code it once and then refer it to it wherever you need it.
Code that is DAMP and DRY is easier to read and modify than code that is cryptic and repetitive. My aim is for simplicity, readability, and customizability.
The DAMP principal is particularly helpful for working with command-line tools that have very cryptic names and options. I wrap those in bash functions with DAMP names. Then I string the functions together in pipelines that feed data from one to the next, or in simple sequences.
If you don't recognize the tools I've used, look up tutorials on them, as well as bash scripting. They're very powerful. There are also others that you might find useful.
Scripting can be an art form in itself. You can also get too clever with it and then no one can understand them. How far and how sophisticated you get depends on your needs. You also need to balance the tradeoff of time spent on them with benefits gained.
Ultimately, they are tools to help you do your job better, more effectively and efficiently, not an end in themselves.
Here's the script, process_heap_logs (which works with MSYS2 bash, where I wrote it, but doesn't work with the bash on my Mac, urrgh!):
#!/usr/bin/env bash

# Process log files to create CSV file of heap statistics, with one entry
# per hour.
#
# Reads multiple log files based on filename pattern argument $1, in the
# form <name>.<type>. Files must be named such that the wildcard <name>*.<type>
# finds them all, in order.
#
# Creates files <name>.trg, <name>.sum, and <name>.csv.
#
# Requires bash shell and command-line tools, such as MSYS2 or Git Bash for
# Windows, or Linux.

# Sets of fields to extract from log lines.
HEAD_FIELDS=1,9,12,15,18
DATA_FIELDS=1,10,13,16,19

#
# Pipable functions to simplify commands.
#

# Get first line of a text file.
get_first_line(){
    head -1 $1
}

# Strip hex data trailer from end of each line.
strip_trailer(){
    sed "s/ 0x81.*//"
}

# Strip fixed-length header from each line, leaving HH:MM timestamp.
strip_header(){
    cut -b 1-5,49-
}

insert_string(){
    sed "s/\(.*\)/$1\1/"
}

# Extract a set of fields separated by spaces from each line.
extract_fields(){
    cut -d ' ' -f $1
}

# Make a wildcard from a filename.
make_wildcard(){
    echo $1 | sed "s/\./*\./"
}

# Make a filename with a new type.
make_filetype(){
    echo $1 | sed "s/\..*/\.$2/"
}

# Translate space-separated values to Comma Separated Values in each line.
make_csv(){
    tr ' ' ,
}

# Trim all the logs to the target data.
trim_logs(){
    ALL_LOGS=$(make_wildcard $LOG_FILE)
    grep -h "$TARGET" $ALL_LOGS | strip_trailer > $TRG_FILE
}

# Create summary file.
create_summary(){
    get_first_line $TRG_FILE >  $SUM_FILE
    grep ":00:00"  $TRG_FILE >> $SUM_FILE
}

# Create CSV file from summary file, with header line that adds Time column, and converts timestamps to strings.
create_csv(){
    get_first_line $SUM_FILE | strip_header | insert_string "Time " | extract_fields $HEAD_FIELDS | make_csv >  $CSV_FILE
    cat            $SUM_FILE | strip_header | insert_string "'"     | extract_fields $DATA_FIELDS | make_csv >> $CSV_FILE
}

#
# Main body.
#
if [ $# -eq 0 ]
then
    echo "Specify logfile name pattern argument."
else
    # Files: Extract target lines from log file(s) to target file,
    # extract hourly entries from target to summary file,
    # extract data fields from summary to CSV file.
    LOG_FILE=$1
    TRG_FILE=$(make_filetype $LOG_FILE trg)
    SUM_FILE=$(make_filetype $LOG_FILE sum)
    CSV_FILE=$(make_filetype $LOG_FILE csv)
    # Target string to search for.
    TARGET="heap profile data total_bytes"
    trim_logs
    create_summary
    create_csv
fi
The script takes one parameter, the filename pattern, as described in the header comments.
The shebang #!/usr/bin/env bash on the first line means I can run it simply by typing the name (with an initial ./ since this script isn't in my PATH). The file needs to be executable, which you specify this way:
$ chmod +x process_heap_logs
My logs are split into two files, heap_usage_1.txt and heap_usage_2.txt, containing tens of thousands of lines from 8 hours of running. To run the script and view the output:
$ ./process_heap_logs heap_usage.txt

$ cat heap_usage.sum
20:34:08.719 Debug [       frammulator.c    203] heap profile data total_bytes = 3112960 used_bytes = 1384827 heap_used_bytes = 1432904 free_memory_bytes = 1680056 max_used = 1452360  max_request = 64640
21:00:00.719 Debug [       frammulator.c    203] heap profile data total_bytes = 3112960 used_bytes = 1400567 heap_used_bytes = 1451288 free_memory_bytes = 1661672 max_used = 1467460  max_request = 64640
22:00:00.719 Debug [       frammulator.c    203] heap profile data total_bytes = 3112960 used_bytes = 1468251 heap_used_bytes = 1530216 free_memory_bytes = 1582744 max_used = 1536654  max_request = 64640
23:00:00.719 Debug [       frammulator.c    203] heap profile data total_bytes = 3112960 used_bytes = 1503887 heap_used_bytes = 1571752 free_memory_bytes = 1541208 max_used = 1571420  max_request = 64640
00:00:00.719 Debug [       frammulator.c    203] heap profile data total_bytes = 3112960 used_bytes = 1537143 heap_used_bytes = 1610552 free_memory_bytes = 1502408 max_used = 1603768  max_request = 64640
01:00:00.719 Debug [       frammulator.c    203] heap profile data total_bytes = 3112960 used_bytes = 1572175 heap_used_bytes = 1651384 free_memory_bytes = 1461576 max_used = 1638500  max_request = 64640
02:00:00.719 Debug [       frammulator.c    203] heap profile data total_bytes = 3112960 used_bytes = 1608415 heap_used_bytes = 1693624 free_memory_bytes = 1419336 max_used = 1675344  max_request = 64640
03:00:00.719 Debug [       frammulator.c    203] heap profile data total_bytes = 3112960 used_bytes = 1627743 heap_used_bytes = 1716152 free_memory_bytes = 1396808 max_used = 1697088  max_request = 64640
04:00:00.719 Debug [       frammulator.c    203] heap profile data total_bytes = 3112960 used_bytes = 1627139 heap_used_bytes = 1715448 free_memory_bytes = 1397512 max_used = 1697088  max_request = 64640

$ cat heap_usage.csv
Time,used_bytes,heap_used_bytes,free_memory_bytes,max_used
'20:34,1384827,1432904,1680056,1452360
'21:00,1400567,1451288,1661672,1467460
'22:00,1468251,1530216,1582744,1536654
'21:00,1503887,1571752,1541208,1571420
'22:00,1537143,1610552,1502408,1603768
'23:00,1572175,1651384,1461576,1638500
'00:00,1608415,1693624,1419336,1675344
'01:00,1627743,1716152,1396808,1697088
'02:00,1627139,1715448,1397512,1697088
I can easily see from the numbers that the heap has grown, but this graph from importing the CSV file into a Google Drive spreadsheet shows the pattern:
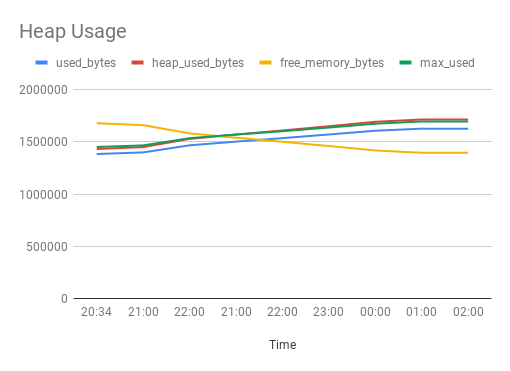
So now I can see the growth rate, showing some variation.
An Additional Usage
One thing I've found useful in the past is to automate matching log signatures with known bugs in a bug-tracking system such as Jira, then reporting which bugs match the signature.
A signature is simply some pattern of text (possibly split over different lines) that is a clear symptom of a known bug. For instance, when the log says "ERROR: Frammulator value -1, hooverdexter state CHARGING", that is clearly bug FRAM-78.
The problem is that messages such as these are meaningless gobbledygook to everyone except the developer. So anyone encountering them spends time to create a bug report and upload logs. Then the developer has to spend the time on the bug, examining the logs and marking the bug as a duplicate. This slows both testing and development.
Having an automated script helps to triage logs from SQA testers to quickly decide if they've simply encountered another instance of a known bug. They can run the automated script themselves and save everybody a lot of time if it is, so that the team can focus on fixing the bugs and identifying the truly new ones.
So far my implementations of this have been very crude. This starts to stretch the capabilities of what bash scripting can do, and moves into the realm of Python, where you can build a more powerful pattern-matching engine. That's another topic for another post.


- Comments
- Write a Comment Select to add a comment
To post reply to a comment, click on the 'reply' button attached to each comment. To post a new comment (not a reply to a comment) check out the 'Write a Comment' tab at the top of the comments.
Please login (on the right) if you already have an account on this platform.
Otherwise, please use this form to register (free) an join one of the largest online community for Electrical/Embedded/DSP/FPGA/ML engineers:


