


Whoa! That has got to be the most serious-minded title I’ve ever written. Profitability Metrics from Financial Statements, indeed. I’m still writing Part 2 of my Supply Chain Games article, and I was about to mention something about whether a company is profitable, when I realized something that didn’t quite fit into the flow of things, so I thought I’d handle it separately: how are you supposed to know what I mean, when I say a company is profitable? And how am I supposed to know when a company is profitable?
This is perhaps a dumb-sounding question, of the Who-is-Buried-in-Grant’s-Tomb type. After all, you can look at a company’s net earnings. If it’s positive, it’s profitable, otherwise it’s not.
Let’s handle the easy part first.
Finding Those Financial Statements and Earnings Announcements
This is the only time I will ever offer investment advice in my blog:
If you are an electrical or embedded systems engineer, you should be familiar with reading financial statements of the companies that produce goods or services you work with professionally. There are two complementary reasons for this:
-
You should read financial statements anyway, if you’re thinking about investing in any company — but the ones in your realm of professional familiarity will likely be a bit easier for you to understand than the financial statements of other companies, and are a good way to introduce yourself to reading these documents.
-
In my opinion, it gives you a microscopic, but nonzero, advantage in understanding the investment value of these companies, over other people who have the same level of experience you do in investing and understanding businesses, but who are not familiar with the technical details of these companies, like what an op-amp or a microcontroller is.
Okay, end of advice; that’s it. Everything I ever mention about specific companies is not meant as investment advice. In today’s article I have intentionally chosen the period of 2001 - 2008 (between the 2000 dot-com bubble and the 2008 financial crisis), in part because it is Past History and a lot has changed since then.
(Also, some disclaimers: I am not an accountant, so there may be errors in this article; please do your own due diligence, and I would appreciate any feedback to improve accuracy and clarity. The views and opinions expressed in this article are my own and are not representative of my employer.)
Now for the financial statements. I’m only going to give examples of companies that produce semiconductors, but the principles of financial statements are broadly applicable to any public company, especially a company that sells products rather than services.
Almost all of the large firms in the semiconductor industry are public companies, and they issue quarterly and annual reports. These financial documents you can find in two ways:
- on a company’s website, under Investor Relations
- on the Securities and Exchange Commission’s EDGAR website — US companies file 10-K annual reports and 10-Q quarterly reports; non-US companies may also submit SEC filings (such as 20-F annual reports)
Here is an example, from National Semiconductor’s earnings announcement of June 7, 2007:

There, net income of \$90.1 million, or 28 cents per share, for the quarter ending May 27, 2007. Both are positive numbers, so National Semiconductor was profitable during this quarter. (By the way, in case you weren’t aware, Texas Instruments later acquired National Semiconductor in April 2011.)
Easy-peasy, right?
The Fine Print
Further down in the earnings release is some fine print, including this table:

There are two things to note.
One is the little (Unaudited) qualifier at the top. Public companies work with outside accounting firms to audit their financial results; the audited results are in the annual reports rather than the press releases, although some companies don’t give any earnings announcement until the audited reports are in. (June 7 seems extremely early to report earnings on the quarter ending May 28.)
The second is that there are two lines under “Earnings per share”, one marked Basic and the other Diluted, with different numbers, because the calculations are based on different number of shares. Basic earnings per share is based on the number of stock shares in existence. Diluted earnings per share is based on the potential number of stock shares, including stock options that may vest in the future. Most companies which offer stock options, or grants of restricted stock, will issue new shares of stock upon vesting that dilute the ownership slightly by increasing the total number of shares.
Furthermore, some companies report both GAAP and non-GAAP earnings in their earnings announcements. GAAP means Generally Accepted Accounting Principles and refers to technical rules of accounting so that company financial statements can be compared on an even basis. Non-GAAP earnings can be computed differently, for example, excluding stock-based compensation or other expenses that the company feels are distracting from a good picture of its core business — and have some restrictions on how they can be presented; I’m not 100% sure but it looks like the official SEC quarterly and annual reports are allowed to contain only GAAP financial measures.
The 2007 Annual Report for National Semiconductor was filed on July 26, 2007, and contains audited financial statements such as this one:

This has four lines of earnings per share; one set of Basic + Diluted values was computed differently using an update in the GAAP rules, with a very minor difference. The diluted values of earnings per share are the same \$1.12 per share as in the earnings release from June 7.
2004 - 2007 were profitable years for National Semiconductor; 2003’s income numbers have parentheses around them, meaning a net loss, rather than net income.
Staying well above zero
One other thing to note about earnings and profitability, is that the company and its investors want significant profit, not just some profit. If National had earned \$10 in net income for five years in a row — that’s ten dollars, not ten million dollars — that would be profitable, but the shareholders would probably not be happy. This is perhaps obvious, but needs to be stated.
Profit metrics and ratios
I’m not going to talk about share prices, or delve any further into earnings per share, or the difference between GAAP and non-GAAP earnings; the rest of this article concerns itself with profit margin.
There are three metrics of profit margin that are often useful to look at:
- gross margin (sometimes listed in absolute terms as gross profit)
- operating margin (sometimes listed in absolute terms as operating profit or operating income)
- net margin (often listed in absolute terms as net income)
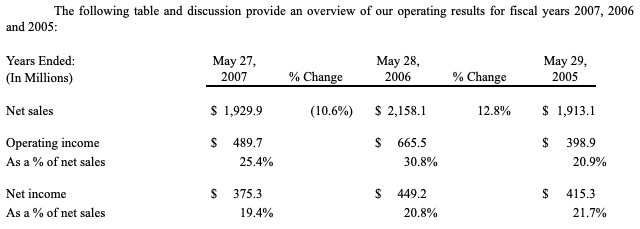
The financial statements give all of these, either directly or indirectly via data that can be used to compute them. Tables like the SELECTED FINANCIAL DATA listed above are usually in a similar form, starting with net sales (equivalently, revenue) at the top, and subtracting off costs until you get to net income.
National listed \$1,929.9 million in net sales (revenue) for the year ending May 27 2007.
Below that is a line stating “Cost of sales”, for \$757.7 million. This is supposed to include all of the costs needed to produce inventory for the year, such as:
- Raw materials needed to make semiconductors (wafers, chemicals, etc.)
- Labor costs of manufacturing
- Utility costs (electricity, water, sewer, etc.) of manufacturing facilities
- Depreciation of the manufacturing plant and equipment — let’s say that National spent \$1 billion on a plant, consisting of \$300 million for the building and \$700 million for the manufacturing equipment, and they depreciate the building in 15 years (\$20 million per year) and the equipment in 5 years (\$140 million per year), for a total of \$160 million per year. (These are just numbers I made up to point out the principle.)
Subtracting the cost of sales gives you the gross margin. (\$1,172.2 million in this 2007 report.)
Below that is a line labeled “Operating expenses”, which is supposed to include costs the company incurs to sell that inventory. Sometimes these are divided up as separate line items, such as Sales, General, & Administrative (SG&A) expenses. Operating expenses include all the other expenses the company incurs, except for interest and taxes and certain “other” income.
Subtracting operating expenses from gross margin gives you the operating income. (\$489.7 million in this 2007 report.)
Below that are the interest/taxes/”other” income lines.
Subtracting these from the operating margin gives you the net income. (\$375.3 million in this 2007 report.)
Companies will often present the net/operating/gross income in relative terms, as a percentage of sales (revenue). If we divide by the \$1,929.9 million in revenue in this 2007 report, we get:
- 60.7% gross margin
- 25.4% operating margin
- 19.4% net margin
And in fact these numbers are given directly in other tables in the report:

for gross margin, and
for operating and net margin.
- Gross margin measures the profitability of manufacturing.
- Operating margin measures the profitability of the business aside from interest/taxes.
- Net margin measures the bottom-line profitability.
The difference between operating margin and net margin doesn’t have much to do with the core business; it can be affected by a company’s financial departments to take advantage of tax efficient strategies, but those have very little to do with its ability to make and sell widgets.
These ratios are often useful to highlight whether a business is healthy and competitive, or it may be exhibiting signs of financial weakness.
Easy or not-so-easy
It is easier to pluck out this information from some financial statements than from others. Here’s a table from Intel’s 2006 Annual Report:

You can just read gross margin and operating margin right off the chart.
Others are not so easy. Here is a table from International Rectifier’s 2003 Annual Report:

Operating income is not shown here; you either have to start from gross profit and subtract the next four lines, or start from income before income taxes, and back out the “other” income and interest income. (For example, \$-126,198 income before income taxes, plus \$-671 + \$22 = \$-126,847 thousand operating income; divide by the \$864,443 thousand total revenue to get -14.7% operating margin.)
Comparing Profit Ratios
I have plotted the gross margin and operating margin from a dozen semiconductor companies in the 2001-2008 time frame:

You can see a general trend of increasing profit margins in this graph; again, this is between the dot-com bubble and the 2008 financial crisis, in a period of gradually-improving macroeconomic conditions.
All of these companies had fiscal years ending December 31, except where noted below (FYE = Fiscal year-end), which is why some of the points are shifted left or right. The plotted points represent the end of the fiscal year, so the points coinciding with the “2002” axis tick mark represent the fiscal year ending December 31, 2001.
- ATML = Atmel
- CY = Cypress Semiconductor
- INTC = Intel
- IRF = International Rectifier (FYE = end of June)
- MCHP = Microchip Technology (FYE = end of March)
- MU = Micron Technology (FYE = end of August)
- NSM = National Semiconductor (FYE = end of May)
- POWI = Power Integrations
- STM = ST Microelectronics
- TSMC = Taiwan Semiconductor
- TXN = Texas Instruments
- XLNX = Xilinx (FYE = end of March)
This is by no means an exhaustive list, but there’s only so much you can put in a graph without adding too much clutter, and I wanted to get a good variety from among the semiconductor firms.
Why do gross margin and operating margin matter? There are two reasons I can think of:
- The stock price is affected — shareholders and investors and analysts notice these profit metrics, and a company with higher profit margins will be seen as more attractive and command a higher stock price.
- Companies with lower profit margins may be attractive takeover targets to their larger competitors. If company B has a gross margin of 45% and company A has a gross margin of 65%, and they make similar kinds of stuff, then company A’s management is probably going to crunch the numbers and see if it makes sense to buy company B and restructure it, installing their own leadership and policies, to raise those margins and improve the earnings of the combined company. (this is called “accretive to earnings”)
Indeed, three of the companies in this group, which had lower operating margins, went through proxy contests — Atmel in 2007, International Rectifier in 2008, and Cypress in 2017 — that attempted to change the board of directors, and all of them eventually were acquired by other companies: IR and Cypress by Infineon in 2015 and 2020, and Atmel by Microchip in 2016. When members of the herd are injured and lag behind, the wolves and vultures circle and close in.
Wrapup
Today we looked at some profitability metrics for businesses, notably gross margin and operating margin, and pointed out how to calculate them from entries on a company’s financial statement filed with the US Securities and Exchange Commission.
- Gross margin measures the percentage of revenues left over, after subtracting out the manufacturing cost of the goods sold to earn those revenues. It measures the manufacturing profitability.
- Operating margin measures the percentage of revenues left over, after subtracting out all the costs except interest expense, taxes, and “other” expenses. (Don’t ask me what “other” means.) It is supposed to measure the profitability of the core business.
© 2022 Jason M. Sachs, all rights reserved.


