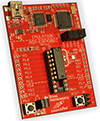
I'm maintaining some code on a BL2600 board and recently saw an unhandled
RST38 error while in debug mode. From what I found on the internet this
normally means writing outside an array boundary or a stack overflow. I
made a few changes to the code and the error went away but I wanted to
check further to make sure there wasn't a problem.

I found that if I start my program from DynamicC 9.62 in debug mode and
put a breakpoint somewhere, I can view the Debug Windows -> Stack Trace
and see a few bytes written to the stack and everything looks OK. I can
put the breakpoint somewhere else and see a different stack trace as
expected.

If I just start the program and check the Debug Windows -> Stack Trace
without using a breakpoint, I see 9008 bytes traced and Overflow - 4096
bytes allocated. The program does seem to work without any runtime errors.
I would expect if the stack were overflowed by that amount I would be
having major problems. I also implemented a Stack Limit Violation ISR to
trap any overflow, it never fires.

Is the stack really overflowed by that amount, or does it show an overflow
because I didn't put a breakpoint in to halt the program before checking
the stack trace?


---------------------------------------
Posted through http://www.EmbeddedRelated.com

Rabbit Stack Trace Overflow
Started by ●April 15, 2015
Reply by ●April 17, 20152015-04-17
I think I have my answer. I implemented a Stack Limit Violation interrupt
as suggested at the bottom of
http://www.embeddedrelated.com/showthread/rabbit-semi/38709-1.php. Forcing
a stack overflow brings up the system error handler and shows the file
name and line number that caused the overflow. Actually the line number
was just the last line of the function where the overflow occurred.

I also implemented code from http://shdesigns.org/files/STACKCHECK.C to
fill the stack with 0xff at the start of main(). I periodically check the
stack usage and print out the low water mark when it changes.

When I run my program, the Stack Limit Violation interrupt never fires
unless I force a stack overflow. The check_stack function shows a low
water mark for my program of 2994 bytes of 4096 unused in stack, nowhere
near an overflow.

Using DynamicC's Debug Windows -> Stack Trace still shows 9008 bytes used
and a stack overflow unless I set a breakpoint somewhere first. Then it
shows the current stack usage which is usually something less than 16
bytes. I'm not too sure where the 9008 bytes came from but the Stack Trace
is obviously not correct until a breakpoint is set first.

---------------------------------------
Posted through http://www.EmbeddedRelated.com


