Contents:
Introduction
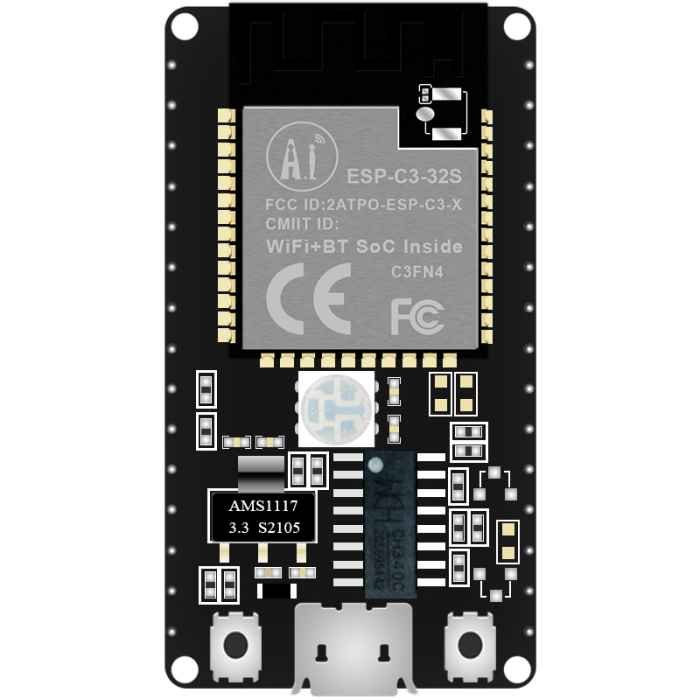
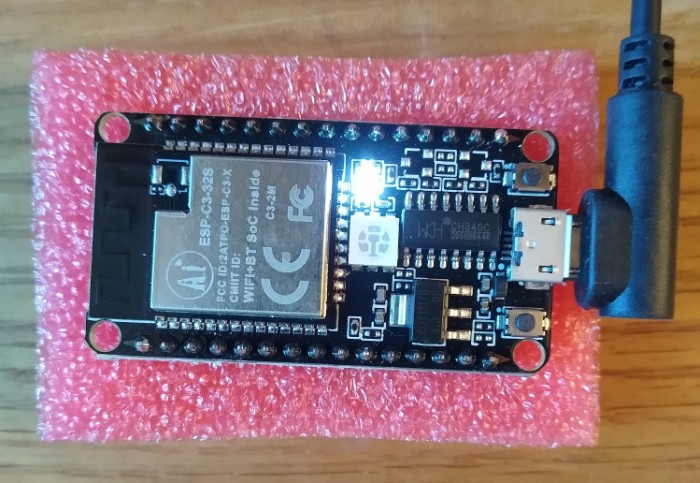
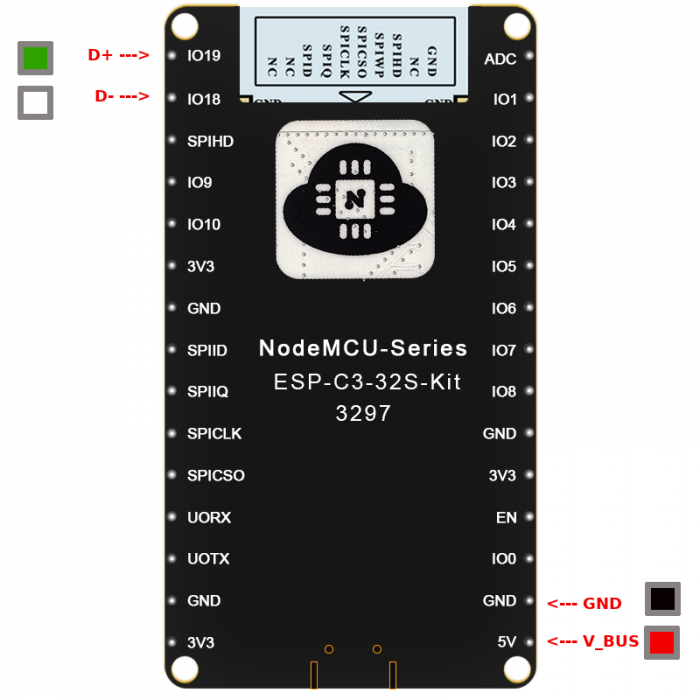
The ESP-C3-32S-Kit is a small dev board made by Ai.Thinker, containing an ESP-C3-32S SoC module, supporting WiFi and BLE:
Development for the board uses the Espressif IoT Development Framework (ESP-IDF), which the Ai.Thinker documentation refers to as the "Secondary development SDK".
You can get two of these for prototyping, using one as a BLE peripheral (the peripheral device you connect to, such as headphones or a mouse) and the other as a BLE central (the central device that connects to the peripheral, such as a smartphone or laptop).
ESP-IDF bundles software stacks and example applications for both of these use cases. This page shows using the Apache MyNewt NimBLE stack with FreeRTOS.
Much of the information on this page is useful for working with other ESP32 boards, since ESP-IDF is the official SDK for the ESP32 product line. Some of it is also useful for working with other vendor devices and BLE software stacks.
Links
You can use phone apps like Nordic nRF Connect for Mobile to connect to these as either the peripheral or central for testing.
Another very useful tool is the Nordic BLE sniffer, which is custom firmware for a Nordic nRF52840 USB dongle:
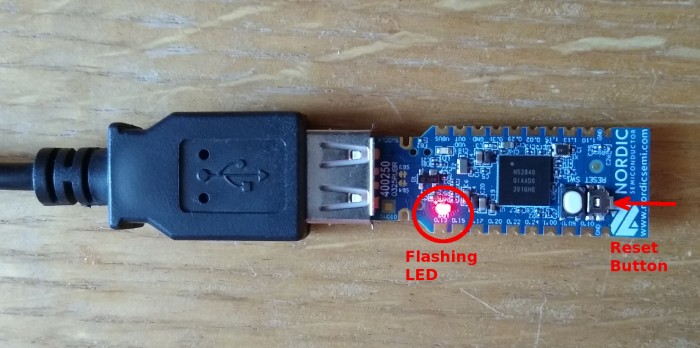
The sniffer software includes a Wireshark package so that you can capture, analyze, and view BLE traffic on your laptop.
BLE Learning Resources
These resources aren't necessarily required to work with the ESP-C3-32S-Kit, but if you really want to understand BLE, they provide a good foundation and many subtle details.
The specifications are very long and probably far more detailed that you need. In general, the other resources summarize specific topics in a much briefer form.
I always like to learn from multiple resources, because each one offers a slightly different perspective and coverage.
Getting Started
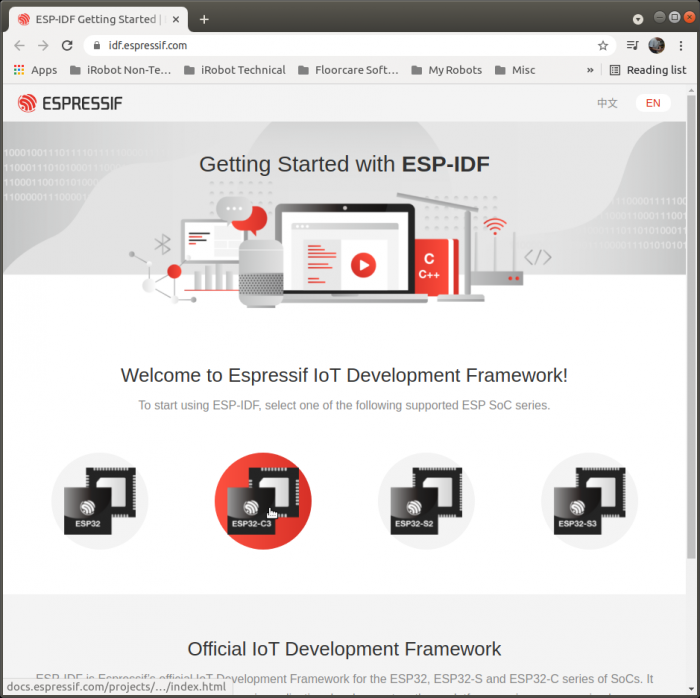
On the Getting Started with ESP-IDF page, click on the ESP32-C3 chip image (see red highlighted chip below) to get to the ESP-IDF Programming Guide. You can also navigate directly to ESP-IDF Programming Guide: Get Started or any of the Reference links below to go to the appropriate sections.
Cables
For programming and monitoring, you will need a micro USB data and charging cable. The board will not show up as a /dev/ttyUSB* device if you use a charging-only cable.
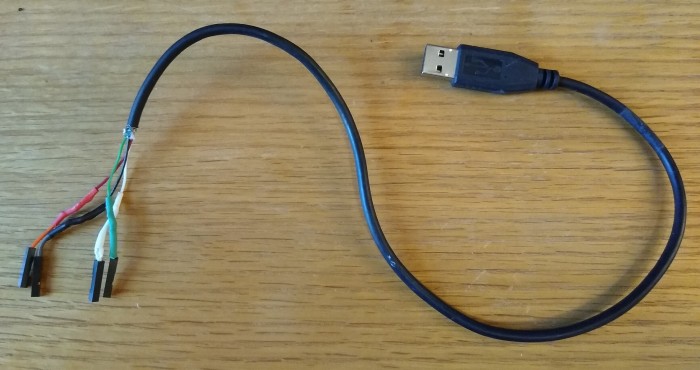
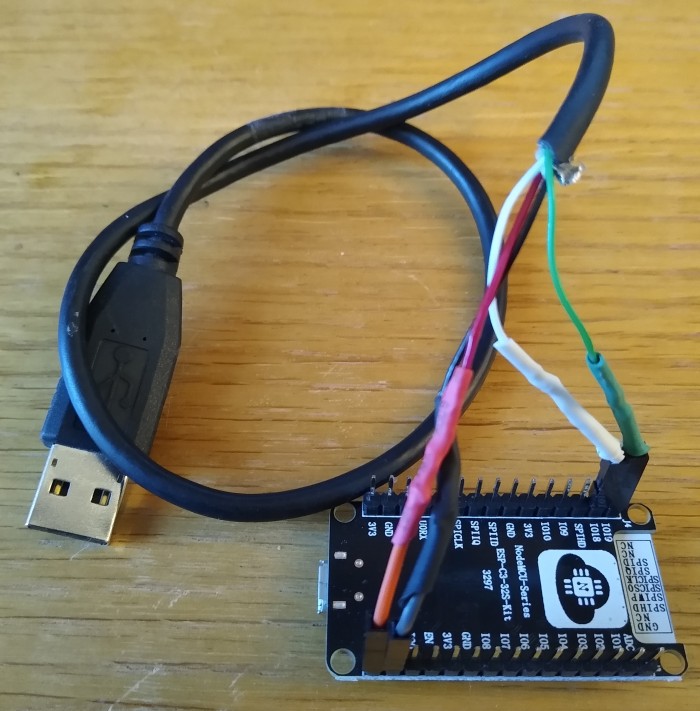
For debugging, you will need a USB data and charging cable with female connectors that fit on the board pins. You can modify an existing cable by cutting it and soldering on female jumper ends:
For the Nordic sniffer dongle, a USB-A extension cable allows you to move it around to receive BLE signals better.
Since two ESP-C3-32S-Kits, a debug cable, and a dongle require 4 USB ports, you may need a USB hub.
ESP-IDF Installation
ESP-IDF Programming Guide: Get Started contains instructions for installing ESP-IDF on Windows, Linux, and Mac OS.
This page shows actual installation on a Linux Ubuntu 18.04 laptop. Existing Linux configurations may create conflicts that require additional steps not covered by the ESP-IDF documentation, for instance the installed Python version.
The Step X headings here are the steps listed in the ESP-IDF Programming Guide; the Reference links in each section refer to the relevant instructions in the guide.
Step 1. Install prerequisites (Linux)
Reference: Get Started: Linux Setup
Refer to the reference to see the Linux prerequisites. Install them before proceeding to step 1a.
1a. Dialout Group
You will need to be a member of the dialout group in order to access the serial port. Add your username with this command:
sudo usermod -a -G dialout \$USER
You will need to logout and back in to apply this (you may need to reboot your laptop to apply it).
Verify that the command has been applied with this command, and look for the dialout group (there may be many groups):
id -Gn
Example:
sbranam@NA-H17LM53:~\$ id -Gn
sbranam dialout sudo wireshark domain_users dl-all proe_users ...
^ ^
| |
Step 2. Get ESP-IDF
Reference: Get ESP-IDF
Run the following commands to clone the ESP-IDF repo from Github (this includes a number of submodules):
mkdir -p ~/esp
cd ~/esp
git clone --recursive https://github.com/espressif/esp-idf.git
All remaining steps take place in the esp-idf directory, so change to that:
cd esp-idf
2a. Python Version
Your Linux may be setup to use Python 2 as the default. The installation process needs Python 3. This requires two changes:
- Define an alias for python. This is only required for performing installation.
- Modify two lines in file tools/idf_tools.py, function action_install_python_env().
Define this alias:
alias python=python3
Make these changes to tools/idf_tools.py:
sbranam@NA-H17LM53:~/esp/esp-idf\$ git diff
diff --git a/tools/idf_tools.py b/tools/idf_tools.py
index b1bf848ae..803646f4d 100755
--- a/tools/idf_tools.py
+++ b/tools/idf_tools.py
@@ -1514,9 +1514,9 @@ def action_install_python_env(args): # type: ignore
subprocess.check_call([sys.executable, '-m', 'pip', 'install', '--user', 'virtualenv'],
stdout=sys.stdout, stderr=sys.stderr)
- subprocess.check_call([sys.executable, '-m', 'virtualenv', idf_python_env_path],
+ subprocess.check_call([sys.executable, '-m', 'virtualenv', '--python=/usr/bin/python3', idf_python_env_path],
stdout=sys.stdout, stderr=sys.stderr)
- run_args = [virtualenv_python, '-m', 'pip', 'install', '--no-warn-script-location']
+ run_args = [virtualenv_python, '-m', 'pip', 'install']
requirements_txt = os.path.join(global_idf_path, 'requirements.txt')
run_args += ['-r', requirements_txt]
if args.extra_wheels_dir:
Reference: Set up the tools
Run the following command to setup the tools for all supported targets:
./install.sh
Example (note the all done message at the end indicating ready to export environment variables):
sbranam@NA-H17LM53:~/esp/esp-idf\$ ./install.sh
Detecting the Python interpreter
Checking "python" ...
Python 3.6.9
"python" has been detected
Installing ESP-IDF tools
Selected targets are: esp32, esp32s2, esp32c3, esp32s3
Installing tools: xtensa-esp32-elf, xtensa-esp32s2-elf, xtensa-esp32s3-elf, riscv32-esp-elf, esp32ulp-elf, esp32s2ulp-elf, openocd-esp32
...(more lines of install output)...
Installing collected packages: zipp, typing-extensions, six, MarkupSafe, importlib-metadata, Werkzeug, python-engineio, Jinja2, itsdangerous, click, python-socketio, pycparser, greenlet, Flask, brotli, Pygments, pygdbmi, gevent, Flask-SocketIO, Flask-Compress, cffi, reedsolo, pyserial, pyparsing, pyelftools, kconfiglib, gdbgui, future, ecdsa, cryptography, construct, bitstring
Successfully installed Flask-0.12.5 Flask-Compress-1.10.1 Flask-SocketIO-2.9.6 Jinja2-3.0.1 MarkupSafe-2.0.1 Pygments-2.9.0 Werkzeug-0.16.1 bitstring-3.1.9 brotli-1.0.9 cffi-1.14.6 click-8.0.1 construct-2.10.54 cryptography-3.4.7 ecdsa-0.17.0 future-0.18.2 gdbgui-0.13.2.0 gevent-1.5.0 greenlet-1.1.0 importlib-metadata-4.6.1 itsdangerous-2.0.1 kconfiglib-13.7.1 pycparser-2.20 pyelftools-0.27 pygdbmi-0.9.0.2 pyparsing-2.3.1 pyserial-3.5 python-engineio-3.14.2 python-socketio-4.6.1 reedsolo-1.5.4 six-1.16.0 typing-extensions-3.10.0.0 zipp-3.5.0
All done! You can now run:
. ./export.sh
If there are any problems with the installation, either during this step or subsequently, you can easily remove it, then repeat the install.sh script. To remove it:
rm -rf ~/.espressif
ESP-IDF Development
Examples
ESP-IDF includes a number of examples in the examples directory, each with a README.md file.
The simplest one is get-started/hello_world. This boots, prints a "Hello world!" message and board information, then counts down for 10 seconds and resets, repeating this boot loop forever.
The remaining examples will use hello_world.
Step 4. Set up the environment variables
Reference: Set up the environment variables
Whenever you start a terminal session for building, you must set up the environment with the following command:
. ./export.sh
Example (note the done message at the end indicating ready to build a project):
sbranam@NA-H17LM53:~/esp/esp-idf\$ . ./export.sh
Setting IDF_PATH to '/home/sbranam/esp/esp-idf'
Detecting the Python interpreter
Checking "python" ...
Checking "python3" ...
Python 3.6.9
"python3" has been detected
Adding ESP-IDF tools to PATH...
Not using an unsupported version of tool openocd-esp32 found in PATH: 0.10.0.
Using Python interpreter in /home/sbranam/.espressif/python_env/idf4.4_py3.6_env/bin/python
Checking if Python packages are up to date...
Python requirements from /home/sbranam/esp/esp-idf/requirements.txt are satisfied.
Added the following directories to PATH:
/home/sbranam/esp/esp-idf/components/esptool_py/esptool
/home/sbranam/esp/esp-idf/components/espcoredump
/home/sbranam/esp/esp-idf/components/partition_table
/home/sbranam/esp/esp-idf/components/app_update
/home/sbranam/.espressif/tools/xtensa-esp32-elf/esp-2021r1-8.4.0/xtensa-esp32-elf/bin
/home/sbranam/.espressif/tools/xtensa-esp32s2-elf/esp-2021r1-8.4.0/xtensa-esp32s2-elf/bin
/home/sbranam/.espressif/tools/xtensa-esp32s3-elf/esp-2021r1-8.4.0/xtensa-esp32s3-elf/bin
/home/sbranam/.espressif/tools/riscv32-esp-elf/esp-2021r1-8.4.0/riscv32-esp-elf/bin
/home/sbranam/.espressif/tools/esp32ulp-elf/2.28.51-esp-20191205/esp32ulp-elf-binutils/bin
/home/sbranam/.espressif/tools/esp32s2ulp-elf/2.28.51-esp-20191205/esp32s2ulp-elf-binutils/bin
/home/sbranam/.espressif/tools/openocd-esp32/v0.10.0-esp32-20210401/openocd-esp32/bin
/home/sbranam/.espressif/python_env/idf4.4_py3.6_env/bin
/home/sbranam/esp/esp-idf/tools
Done! You can now compile ESP-IDF projects.
Go to the project directory and run:
idf.py build
Step 5. Start a Project
Reference: Start a Project
Create a project directory, using one of the examples as a starting point:
cd ~/esp
cp -r \$IDF_PATH/examples/ .
Example:
sbranam@NA-H17LM53:~/esp/esp-idf\$ cd ~/esp
sbranam@NA-H17LM53:~/esp\$ cp -r \$IDF_PATH/examples/get-started/hello_world .
sbranam@NA-H17LM53:~/esp\$ cd hello_world/
sbranam@NA-H17LM53:~/esp/hello_world\$ ls -l
total 96
-rw-rw-r-- 1 sbranam sbranam 235 Jul 30 17:33 CMakeLists.txt
-rw-rw-r-- 1 sbranam sbranam 663 Jul 30 17:33 example_test.py
drwxrwxr-x 2 sbranam sbranam 4096 Jul 30 17:33 main
-rw-rw-r-- 1 sbranam sbranam 182 Jul 30 17:33 Makefile
-rw-rw-r-- 1 sbranam sbranam 2335 Jul 30 17:33 README.md
-rw-rw-r-- 1 sbranam sbranam 36506 Jul 30 17:33 sdkconfig
-rw-rw-r-- 1 sbranam sbranam 63 Jul 30 17:33 sdkconfig.ci
-rw-rw-r-- 1 sbranam sbranam 36506 Jul 30 17:33 sdkconfig.old
sbranam@NA-H17LM53:~/esp/hello_world\$ ls -l main
total 12
-rw-rw-r-- 1 sbranam sbranam 86 Jul 30 17:33 CMakeLists.txt
-rw-rw-r-- 1 sbranam sbranam 145 Jul 30 17:33 component.mk
-rw-rw-r-- 1 sbranam sbranam 1373 Jul 30 17:33 hello_world_main.c
The file main/hello_world_main.c contains the app_main() function. Add your name and date to the "Hello world!" string as a sign of life for the toolchain, to prove that this is your build when you see it running on the board.
Step 6. Connect Your Device
Reference: Connect Your Device
Plug the board into your laptop via USB. Depending on the image in the flash, the white LED may go off shortly after power-on. The black chip adjacent to the USB jack is the CH340 reported in the lsusb output below.
You can locate the board via the following commands:
lsusb
ls -l /dev/ttyU*
Example:
sbranam@NA-H17LM53:~/esp/esp-idf\$ lsusb
...
Bus 001 Device 043: ID 1a86:7523 QinHeng Electronics CH340 serial converter
...
sbranam@NA-H17LM53:~/esp/esp-idf\$ ls -l /dev/ttyU*
crw-rw---- 1 root dialout 188, 0 Jul 30 13:32 /dev/ttyUSB0
The board is on /dev/ttyUSB0, owned by root, but in the dialout group to allow access.
Reference: Configure
You need to set the target any time you start a build session or new project (it defaults to esp32, and needs to be esp32c3 for this board). You may need to run menuconfig to set up project specific variables, e.g. Wi-Fi network name and password, the processor speed, etc. The hello_world example does not need it.
idf.py set-target esp32c3
idf.py menuconfig
Example (note the done messages at the end indicating ready to build):
sbranam@NA-H17LM53:~/esp/hello_world\$ idf.py set-target esp32c3
Adding "set-target"'s dependency "fullclean" to list of commands with default set of options.
Executing action: fullclean
Build directory '/home/sbranam/esp/hello_world/build' not found. Nothing to clean.
Executing action: set-target
Set Target to: esp32c3, new sdkconfig created. Existing sdkconfig renamed to sdkconfig.old.
Running cmake in directory /home/sbranam/esp/hello_world/build
Executing "cmake -G Ninja -DPYTHON_DEPS_CHECKED=1 -DESP_PLATFORM=1 -DIDF_TARGET=esp32c3 -DCCACHE_ENABLE=0 /home/sbranam/esp/hello_world"...
-- Found Git: /usr/bin/git (found version "2.27.0")
-- The C compiler identification is GNU 8.4.0
-- The CXX compiler identification is GNU 8.4.0
-- The ASM compiler identification is GNU
-- Found assembler: /home/sbranam/.espressif/tools/riscv32-esp-elf/esp-2021r1-8.4.0/riscv32-esp-elf/bin/riscv32-esp-elf-gcc
-- Check for working C compiler: /home/sbranam/.espressif/tools/riscv32-esp-elf/esp-2021r1-8.4.0/riscv32-esp-elf/bin/riscv32-esp-elf-gcc
-- Check for working C compiler: /home/sbranam/.espressif/tools/riscv32-esp-elf/esp-2021r1-8.4.0/riscv32-esp-elf/bin/riscv32-esp-elf-gcc -- works
-- Detecting C compiler ABI info
-- Detecting C compiler ABI info - done
-- Detecting C compile features
-- Detecting C compile features - done
-- Check for working CXX compiler: /home/sbranam/.espressif/tools/riscv32-esp-elf/esp-2021r1-8.4.0/riscv32-esp-elf/bin/riscv32-esp-elf-g++
-- Check for working CXX compiler: /home/sbranam/.espressif/tools/riscv32-esp-elf/esp-2021r1-8.4.0/riscv32-esp-elf/bin/riscv32-esp-elf-g++ -- works
-- Detecting CXX compiler ABI info
-- Detecting CXX compiler ABI info - done
-- Detecting CXX compile features
-- Detecting CXX compile features - done
-- Project is not inside a git repository, or git repository has no commits; will not use 'git describe' to determine PROJECT_VER.
-- Building ESP-IDF components for target esp32c3
-- Project sdkconfig file /home/sbranam/esp/hello_world/sdkconfig
-- Found PythonInterp: /home/sbranam/.espressif/python_env/idf4.4_py3.6_env/bin/python (found version "3.6.9")
-- Found Perl: /usr/bin/perl (found version "5.26.1")
-- App "hello-world" version: 1
-- Adding linker script /home/sbranam/esp/hello_world/build/esp-idf/esp_system/ld/memory.ld
-- Adding linker script /home/sbranam/esp/esp-idf/components/esp_system/ld/esp32c3/sections.ld.in
-- Adding linker script /home/sbranam/esp/esp-idf/components/esp_rom/esp32c3/ld/esp32c3.rom.ld
-- Adding linker script /home/sbranam/esp/esp-idf/components/esp_rom/esp32c3/ld/esp32c3.rom.api.ld
-- Adding linker script /home/sbranam/esp/esp-idf/components/esp_rom/esp32c3/ld/esp32c3.rom.libgcc.ld
-- Adding linker script /home/sbranam/esp/esp-idf/components/esp_rom/esp32c3/ld/esp32c3.rom.newlib.ld
-- Adding linker script /home/sbranam/esp/esp-idf/components/esp_rom/esp32c3/ld/esp32c3.rom.version.ld
-- Adding linker script /home/sbranam/esp/esp-idf/components/esp_rom/esp32c3/ld/esp32c3.rom.eco3.ld
-- Adding linker script /home/sbranam/esp/esp-idf/components/soc/esp32c3/ld/esp32c3.peripherals.ld
-- Components: app_trace app_update asio bootloader bootloader_support bt cbor cmock coap console cxx driver efuse esp-tls esp32c3 esp_adc_cal esp_common esp_eth esp_event esp_gdbstub esp_hid esp_http_client esp_http_server esp_https_ota esp_https_server esp_hw_support esp_ipc esp_lcd esp_local_ctrl esp_netif esp_phy esp_pm esp_ringbuf esp_rom esp_serial_slave_link esp_system esp_timer esp_websocket_client esp_wifi espcoredump esptool_py expat fatfs freemodbus freertos hal heap idf_test ieee802154 jsmn json libsodium log lwip main mbedtls mdns mqtt newlib nghttp nvs_flash openssl openthread partition_table protobuf-c protocomm pthread riscv sdmmc soc spi_flash spiffs tcp_transport tcpip_adapter tinyusb unity usb vfs wear_levelling wifi_provisioning wpa_supplicant
-- Component paths: /home/sbranam/esp/esp-idf/components/app_trace /home/sbranam/esp/esp-idf/components/app_update /home/sbranam/esp/esp-idf/components/asio /home/sbranam/esp/esp-idf/components/bootloader /home/sbranam/esp/esp-idf/components/bootloader_support /home/sbranam/esp/esp-idf/components/bt /home/sbranam/esp/esp-idf/components/cbor /home/sbranam/esp/esp-idf/components/cmock /home/sbranam/esp/esp-idf/components/coap /home/sbranam/esp/esp-idf/components/console /home/sbranam/esp/esp-idf/components/cxx /home/sbranam/esp/esp-idf/components/driver /home/sbranam/esp/esp-idf/components/efuse /home/sbranam/esp/esp-idf/components/esp-tls /home/sbranam/esp/esp-idf/components/esp32c3 /home/sbranam/esp/esp-idf/components/esp_adc_cal /home/sbranam/esp/esp-idf/components/esp_common /home/sbranam/esp/esp-idf/components/esp_eth /home/sbranam/esp/esp-idf/components/esp_event /home/sbranam/esp/esp-idf/components/esp_gdbstub /home/sbranam/esp/esp-idf/components/esp_hid /home/sbranam/esp/esp-idf/components/esp_http_client /home/sbranam/esp/esp-idf/components/esp_http_server /home/sbranam/esp/esp-idf/components/esp_https_ota /home/sbranam/esp/esp-idf/components/esp_https_server /home/sbranam/esp/esp-idf/components/esp_hw_support /home/sbranam/esp/esp-idf/components/esp_ipc /home/sbranam/esp/esp-idf/components/esp_lcd /home/sbranam/esp/esp-idf/components/esp_local_ctrl /home/sbranam/esp/esp-idf/components/esp_netif /home/sbranam/esp/esp-idf/components/esp_phy /home/sbranam/esp/esp-idf/components/esp_pm /home/sbranam/esp/esp-idf/components/esp_ringbuf /home/sbranam/esp/esp-idf/components/esp_rom /home/sbranam/esp/esp-idf/components/esp_serial_slave_link /home/sbranam/esp/esp-idf/components/esp_system /home/sbranam/esp/esp-idf/components/esp_timer /home/sbranam/esp/esp-idf/components/esp_websocket_client /home/sbranam/esp/esp-idf/components/esp_wifi /home/sbranam/esp/esp-idf/components/espcoredump /home/sbranam/esp/esp-idf/components/esptool_py /home/sbranam/esp/esp-idf/components/expat /home/sbranam/esp/esp-idf/components/fatfs /home/sbranam/esp/esp-idf/components/freemodbus /home/sbranam/esp/esp-idf/components/freertos /home/sbranam/esp/esp-idf/components/hal /home/sbranam/esp/esp-idf/components/heap /home/sbranam/esp/esp-idf/components/idf_test /home/sbranam/esp/esp-idf/components/ieee802154 /home/sbranam/esp/esp-idf/components/jsmn /home/sbranam/esp/esp-idf/components/json /home/sbranam/esp/esp-idf/components/libsodium /home/sbranam/esp/esp-idf/components/log /home/sbranam/esp/esp-idf/components/lwip /home/sbranam/esp/hello_world/main /home/sbranam/esp/esp-idf/components/mbedtls /home/sbranam/esp/esp-idf/components/mdns /home/sbranam/esp/esp-idf/components/mqtt /home/sbranam/esp/esp-idf/components/newlib /home/sbranam/esp/esp-idf/components/nghttp /home/sbranam/esp/esp-idf/components/nvs_flash /home/sbranam/esp/esp-idf/components/openssl /home/sbranam/esp/esp-idf/components/openthread /home/sbranam/esp/esp-idf/components/partition_table /home/sbranam/esp/esp-idf/components/protobuf-c /home/sbranam/esp/esp-idf/components/protocomm /home/sbranam/esp/esp-idf/components/pthread /home/sbranam/esp/esp-idf/components/riscv /home/sbranam/esp/esp-idf/components/sdmmc /home/sbranam/esp/esp-idf/components/soc /home/sbranam/esp/esp-idf/components/spi_flash /home/sbranam/esp/esp-idf/components/spiffs /home/sbranam/esp/esp-idf/components/tcp_transport /home/sbranam/esp/esp-idf/components/tcpip_adapter /home/sbranam/esp/esp-idf/components/tinyusb /home/sbranam/esp/esp-idf/components/unity /home/sbranam/esp/esp-idf/components/usb /home/sbranam/esp/esp-idf/components/vfs /home/sbranam/esp/esp-idf/components/wear_levelling /home/sbranam/esp/esp-idf/components/wifi_provisioning /home/sbranam/esp/esp-idf/components/wpa_supplicant
-- Configuring done
-- Generating done
-- Build files have been written to: /home/sbranam/esp/hello_world/build
Step 8. Build the Project
Reference: Build the Project
Build the project by running:
idf.py build
Example (note the completion message at the end indicating ready to flash):
sbranam@NA-H17LM53:~/esp/hello_world\$ idf.py build
Executing action: all (aliases: build)
Running ninja in directory /home/sbranam/esp/hello_world/build
Executing "ninja all"...
[19/954] Generating ../../partition_table/partition-table.bin
...(more lines of build output)...
[953/954] Generating binary image from built executable
esptool.py v3.2-dev
Merged 1 ELF section
Generated /home/sbranam/esp/hello_world/build/hello-world.bin
[954/954] cd /home/sbranam/esp/hello_world/build/esp-idf/esptool_py && /home/sbranam/.espressif/pyth..._world/build/partition_table/partition-table.bin /home/sbranam/esp/hello_world/build/hello-world.bin
hello-world.bin binary size 0x27740 bytes. Smallest app partition is 0x100000 bytes. 0xd88c0 bytes (85%) free.
Project build complete. To flash, run this command:
/home/sbranam/.espressif/python_env/idf4.4_py3.6_env/bin/python ../esp-idf/components/esptool_py/esptool/esptool.py -p (PORT) -b 460800 --before default_reset --after hard_reset --chip esp32c3 write_flash --flash_mode dio --flash_size detect --flash_freq 80m 0x0 build/bootloader/bootloader.bin 0x8000 build/partition_table/partition-table.bin 0x10000 build/hello-world.bin
or run 'idf.py -p (PORT) flash'
Step 9. Flash onto the Device
Reference: Flash onto the Device
Flash the binaries to the board, specifying the USB port device:
idf.py -p flash
Example (note the done message at the end indicating ready to monitor):
sbranam@NA-H17LM53:~/esp/hello_world\$ idf.py -p /dev/ttyUSB0 flash
Executing action: flash
Running ninja in directory /home/sbranam/esp/hello_world/build
Executing "ninja flash"...
[1/5] cd /home/sbranam/esp/hello_world/build/esp-idf/esptool_py && /home/sbranam/.espressif/python_e..._world/build/partition_table/partition-table.bin /home/sbranam/esp/hello_world/build/hello-world.bin
hello-world.bin binary size 0x27740 bytes. Smallest app partition is 0x100000 bytes. 0xd88c0 bytes (85%) free.
[2/5] Performing build step for 'bootloader'
[1/1] cd /home/sbranam/esp/hello_world/build/bootloader/esp-idf/esptool_py && /home/sbranam/.espressif/python_env/idf4.4_py3.6_env/bin/python /home/sbranam/esp/esp-idf/components/partition_table/check_sizes.py --offset 0x8000 bootloader 0x0 /home/sbranam/esp/hello_world/build/bootloader/bootloader.bin
Bootloader binary size 0x4890 bytes. 0x3770 bytes (76%) free.
[2/3] cd /home/sbranam/esp/esp-idf/components/esptool_py && /usr/bin/cmake -D IDF_PATH="/home/sbrana...anam/esp/hello_world/build" -P /home/sbranam/esp/esp-idf/components/esptool_py/run_serial_tool.cmake
esptool.py esp32c3 -p /dev/ttyUSB0 -b 460800 --before=default_reset --after=hard_reset write_flash --flash_mode dio --flash_freq 80m --flash_size 2MB 0x0 bootloader/bootloader.bin 0x10000 hello-world.bin 0x8000 partition_table/partition-table.bin
esptool.py v3.2-dev
Serial port /dev/ttyUSB0
Connecting....
Chip is ESP32-C3 (revision 3)
Features: Wi-Fi
Crystal is 40MHz
MAC: 7c:df:a1:b4:50:fc
Uploading stub...
Running stub...
Stub running...
Changing baud rate to 460800
Changed.
Configuring flash size...
Flash will be erased from 0x00000000 to 0x00004fff...
Flash will be erased from 0x00010000 to 0x00037fff...
Flash will be erased from 0x00008000 to 0x00008fff...
Compressed 18576 bytes to 11207...
Writing at 0x00000000... (100 %)
Wrote 18576 bytes (11207 compressed) at 0x00000000 in 0.7 seconds (effective 222.9 kbit/s)...
Hash of data verified.
Compressed 161600 bytes to 81680...
Writing at 0x00010000... (20 %)
Writing at 0x0001973b... (40 %)
Writing at 0x000202bd... (60 %)
Writing at 0x00027247... (80 %)
Writing at 0x0002fda0... (100 %)
Wrote 161600 bytes (81680 compressed) at 0x00010000 in 3.1 seconds (effective 423.3 kbit/s)...
Hash of data verified.
Compressed 3072 bytes to 103...
Writing at 0x00008000... (100 %)
Wrote 3072 bytes (103 compressed) at 0x00008000 in 0.1 seconds (effective 261.2 kbit/s)...
Hash of data verified.
Leaving...
Hard resetting via RTS pin...
Done
Wrong Target
If you didn't set-target esp32c3 at the Configure step before building, it defaults to the plain esp32 target. This will cause the following error:
A fatal error occurred: This chip is ESP32-C3 not ESP32. Wrong --chip argument?
CMake Error at run_serial_tool.cmake:50 (message):
/home/sbranam/.espressif/python_env/idf4.4_py3.6_env/bin/python
/home/sbranam/esp/esp-idf/components/esptool_py/esptool/esptool.py --chip
esp32 failed
FAILED: CMakeFiles/flash
cd /home/sbranam/esp/esp-idf/components/esptool_py && /usr/bin/cmake -D IDF_PATH="/home/sbranam/esp/esp-idf" -D SERIAL_TOOL="/home/sbranam/.espressif/python_env/idf4.4_py3.6_env/bin/python /home/sbranam/esp/esp-idf/components/esptool_py/esptool/esptool.py --chip esp32" -D SERIAL_TOOL_ARGS="--before=default_reset --after=hard_reset write_flash @flash_args" -D WORKING_DIRECTORY="/home/sbranam/esp/esp-c3-32s-kit/bleprph/build" -P /home/sbranam/esp/esp-idf/components/esptool_py/run_serial_tool.cmake
ninja: build stopped: subcommand failed.
ninja failed with exit code 1
Go back to the Configure step and set-target esp32c3, then repeat the remaining steps to configure, build, and flash the board.
Step 10. Monitor
Reference: Monitor
Monitor the board serial output with the following, terminating the monitor by entering Ctrl-] (ESP-IDF Programming Guide: IDF Monitor lists all keyboad shortcuts):
idf.py -p monitor
Example (note the modified message "Hello world sbranam Jul 30 2021!" before the "Restarting in X seconds..." lines, indicating toolchain proof of life):
sbranam@NA-H17LM53:~/esp/hello_world\$ idf.py -p /dev/ttyUSB0 monitor
Executing action: monitor
Running idf_monitor in directory /home/sbranam/esp/hello_world
Executing "/home/sbranam/.espressif/python_env/idf4.4_py3.6_env/bin/python /home/sbranam/esp/esp-idf/tools/idf_monitor.py -p /dev/ttyUSB0 -b 115200 --toolchain-prefix riscv32-esp-elf- --target esp32c3 --decode-panic backtrace /home/sbranam/esp/hello_world/build/hello-world.elf -m '/home/sbranam/.espressif/python_env/idf4.4_py3.6_env/bin/python' '/home/sbranam/esp/esp-idf/tools/idf.py' '-p' '/dev/ttyUSB0'"...
--- idf_monitor on /dev/ttyUSB0 115200 ---
--- Quit: Ctrl+] | Menu: Ctrl+T | Help: Ctrl+T followed by Ctrl+H ---
ESP-ROM:esp32c3-api1-20210207
Build:Feb 7 2021
rst:0x1 (POWERON),boot:0xc (SPI_FAST_FLASH_BOOT)
SPIWP:0xee
mode:DIO, clock div:1
load:0x3fcd6100,len:0x15d0
load:0x403ce000,len:0x93c
load:0x403d0000,len:0x292c
entry 0x403ce000
I (30) boot: ESP-IDF v4.4-dev-2359-g58022f859-dirty 2nd stage bootloader
I (30) boot: compile time 17:48:59
I (30) boot: chip revision: 3
I (34) boot.esp32c3: SPI Speed : 80MHz
I (39) boot.esp32c3: SPI Mode : DIO
I (43) boot.esp32c3: SPI Flash Size : 2MB
I (48) boot: Enabling RNG early entropy source...
I (54) boot: Partition Table:
I (57) boot: ## Label Usage Type ST Offset Length
I (64) boot: 0 nvs WiFi data 01 02 00009000 00006000
I (72) boot: 1 phy_init RF data 01 01 0000f000 00001000
I (79) boot: 2 factory factory app 00 00 00010000 00100000
I (87) boot: End of partition table
I (91) esp_image: segment 0: paddr=00010020 vaddr=3c020020 size=067d8h ( 26584) map
I (104) esp_image: segment 1: paddr=00016800 vaddr=3fc89a00 size=013b0h ( 5040) load
I (109) esp_image: segment 2: paddr=00017bb8 vaddr=40380000 size=08460h ( 33888) load
I (123) esp_image: segment 3: paddr=00020020 vaddr=42000020 size=16270h ( 90736) map
I (139) esp_image: segment 4: paddr=00036298 vaddr=40388460 size=0146ch ( 5228) load
I (140) esp_image: segment 5: paddr=0003770c vaddr=50000000 size=00010h ( 16) load
I (148) boot: Loaded app from partition at offset 0x10000
I (151) boot: Disabling RNG early entropy source...
I (168) cpu_start: Pro cpu up.
I (176) cpu_start: Pro cpu start user code
I (176) cpu_start: cpu freq: 160000000
I (177) cpu_start: Application information:
I (179) cpu_start: Project name: hello-world
I (185) cpu_start: App version: 1
I (189) cpu_start: Compile time: Jul 30 2021 17:48:55
I (195) cpu_start: ELF file SHA256: e96a2f9afaaae67d...
I (201) cpu_start: ESP-IDF: v4.4-dev-2359-g58022f859-dirty
I (208) heap_init: Initializing. RAM available for dynamic allocation:
I (215) heap_init: At 3FC8BC00 len 00034400 (209 KiB): DRAM
I (221) heap_init: At 3FCC0000 len 0001F060 (124 KiB): STACK/DRAM
I (228) heap_init: At 50000010 len 00001FF0 (7 KiB): RTCRAM
I (235) spi_flash: detected chip: generic
I (239) spi_flash: flash io: dio
I (243) sleep: Configure to isolate all GPIO pins in sleep state
I (250) sleep: Enable automatic switching of GPIO sleep configuration
I (257) cpu_start: Starting scheduler.
Hello world sbranam Jul 30 2021!
This is esp32c3 chip with 1 CPU core(s), WiFi/BLE, silicon revision 3, 2MB external flash
Minimum free heap size: 331768 bytes
Restarting in 10 seconds...
Restarting in 9 seconds...
Restarting in 8 seconds...
Restarting in 7 seconds...
Restarting in 6 seconds...
Restarting in 5 seconds...
Restarting in 4 seconds...
Restarting in 3 seconds...
Restarting in 2 seconds...
Restarting in 1 seconds...
Restarting in 0 seconds...
Restarting now.
ESP-ROM:esp32c3-api1-20210207
Build:Feb 7 2021
rst:0xc (RTC_SW_CPU_RST),boot:0xc (SPI_FAST_FLASH_BOOT)
Saved PC:0x40380640
0x40380640: esp_restart_noos at /home/sbranam/esp/esp-idf/components/esp_system/port/soc/esp32c3/system_internal.c:146 (discriminator 1)
SPIWP:0xee
mode:DIO, clock div:1
load:0x3fcd6100,len:0x15d0
load:0x403ce000,len:0x93c
load:0x403d0000,len:0x292c
entry 0x403ce000
I (35) boot: ESP-IDF v4.4-dev-2359-g58022f859-dirty 2nd stage bootloader
I (35) boot: compile time 17:48:59
I (35) boot: chip revision: 3
I (39) boot.esp32c3: SPI Speed : 80MHz
I (44) boot.esp32c3: SPI Mode : DIO
I (48) boot.esp32c3: SPI Flash Size : 2MB
I (53) boot: Enabling RNG early entropy source...
I (58) boot: Partition Table:
I (62) boot: ## Label Usage Type ST Offset Length
I (69) boot: 0 nvs WiFi data 01 02 00009000 00006000
I (77) boot: 1 phy_init RF data 01 01 0000f000 00001000
I (84) boot: 2 factory factory app 00 00 00010000 00100000
I (92) boot: End of partition table
I (96) esp_image: segment 0: paddr=00010020 vaddr=3c020020 size=067d8h ( 26584) map
I (109) esp_image: segment 1: paddr=00016800 vaddr=3fc89a00 size=013b0h ( 5040) load
I (114) esp_image: segment 2: paddr=00017bb8 vaddr=40380000 size=08460h ( 33888) load
I (128) esp_image: segment 3: paddr=00020020 vaddr=42000020 size=16270h ( 90736) map
I (144) esp_image: segment 4: paddr=00036298 vaddr=40388460 size=0146ch ( 5228) load
I (145) esp_image: segment 5: paddr=0003770c vaddr=50000000 size=00010h ( 16) load
I (153) boot: Loaded app from partition at offset 0x10000
I (156) boot: Disabling RNG early entropy source...
I (172) cpu_start: Pro cpu up.
I (181) cpu_start: Pro cpu start user code
I (181) cpu_start: cpu freq: 160000000
I (181) cpu_start: Application information:
I (184) cpu_start: Project name: hello-world
I (189) cpu_start: App version: 1
I (194) cpu_start: Compile time: Jul 30 2021 17:48:55
I (200) cpu_start: ELF file SHA256: e96a2f9afaaae67d...
I (206) cpu_start: ESP-IDF: v4.4-dev-2359-g58022f859-dirty
I (213) heap_init: Initializing. RAM available for dynamic allocation:
I (220) heap_init: At 3FC8BC00 len 00034400 (209 KiB): DRAM
I (226) heap_init: At 3FCC0000 len 0001F060 (124 KiB): STACK/DRAM
I (233) heap_init: At 50000010 len 00001FF0 (7 KiB): RTCRAM
I (240) spi_flash: detected chip: generic
I (244) spi_flash: flash io: dio
I (248) sleep: Configure to isolate all GPIO pins in sleep state
I (255) sleep: Enable automatic switching of GPIO sleep configuration
I (262) cpu_start: Starting scheduler.
Hello world sbranam Jul 30 2021!
This is esp32c3 chip with 1 CPU core(s), WiFi/BLE, silicon revision 3, 2MB external flash
Minimum free heap size: 331768 bytes
Restarting in 10 seconds...
Restarting in 9 seconds...
Restarting in 8 seconds...
Restarting in 7 seconds...
Ctrl-]
This is the help menu accessed by Ctrl+T followed by Ctrl+H (not all functions are actually supported):
--- idf_monitor (1.1) - ESP-IDF monitor tool
--- based on miniterm from pySerial
---
--- Ctrl+] Exit program
--- Ctrl+T Menu escape key, followed by:
--- Menu keys:
--- Ctrl+T Send the menu character itself to remote
--- Ctrl+] Send the exit character itself to remote
--- Ctrl+R Reset target board via RTS line
--- Ctrl+F Build & flash project
--- Ctrl+A (or A) Build & flash app only
--- Ctrl+Y Toggle output display
--- Ctrl+L Toggle saving output into file
--- Ctrl+I (or I) Toggle printing timestamps
--- Ctrl+P Reset target into bootloader to pause app via RTS line
--- Ctrl+X (or X) Exit program
Debugging
Note that a debugger is not required for general development and operation. The board can be flashed and run via the Micro USB connection. This section describes interactive debugging on a board.
The ESP32-C3 chip includes a built-in USB-to-JTAG interface (diagram from Debugging the ESP32-C3 Device with JTAG):
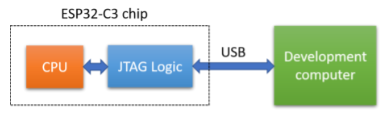
This can be accesssed via OpenOCD to allow debugging via GDB. The ESP-IDF installation includes OpenOCD and ESP-specific board configuration files, as well as the cross-tool version of GDB, xtensa-esp32-elf-gdb:
sbranam@NA-H17LM53:~/esp/esp-idf/blecent\$ which openocd
/home/sbranam/.espressif/tools/openocd-esp32/v0.10.0-esp32-20210401/openocd-esp32/bin/openocd
sbranam@NA-H17LM53:~/esp/esp-idf\$ openocd --version
Open On-Chip Debugger v0.10.0-esp32-20210401 (2021-04-01-15:45)
Licensed under GNU GPL v2
For bug reports, read
http://openocd.org/doc/doxygen/bugs.html
sbranam@NA-H17LM53:~/esp/esp-idf\$ echo \$OPENOCD_SCRIPTS
/home/sbranam/.espressif/tools/openocd-esp32/v0.10.0-esp32-20210401/openocd-esp32/share/openocd/scripts
sbranam@NA-H17LM53:~/esp/esp-idf\$ ls /home/sbranam/.espressif/tools/openocd-esp32/v0.10.0-esp32-20210401/openocd-esp32/share/openocd/scripts/board/esp*
/home/sbranam/.espressif/tools/openocd-esp32/v0.10.0-esp32-20210401/openocd-esp32/share/openocd/scripts/board/esp32c3-builtin.cfg
/home/sbranam/.espressif/tools/openocd-esp32/v0.10.0-esp32-20210401/openocd-esp32/share/openocd/scripts/board/esp32c3-ftdi.cfg
/home/sbranam/.espressif/tools/openocd-esp32/v0.10.0-esp32-20210401/openocd-esp32/share/openocd/scripts/board/esp32-ethernet-kit-3.3v.cfg
/home/sbranam/.espressif/tools/openocd-esp32/v0.10.0-esp32-20210401/openocd-esp32/share/openocd/scripts/board/esp32s2-kaluga-1.cfg
/home/sbranam/.espressif/tools/openocd-esp32/v0.10.0-esp32-20210401/openocd-esp32/share/openocd/scripts/board/esp32-solo-1.cfg
/home/sbranam/.espressif/tools/openocd-esp32/v0.10.0-esp32-20210401/openocd-esp32/share/openocd/scripts/board/esp32-wrover.cfg
/home/sbranam/.espressif/tools/openocd-esp32/v0.10.0-esp32-20210401/openocd-esp32/share/openocd/scripts/board/esp32-wrover-kit-1.8v.cfg
/home/sbranam/.espressif/tools/openocd-esp32/v0.10.0-esp32-20210401/openocd-esp32/share/openocd/scripts/board/esp32-wrover-kit-3.3v.cfg
/home/sbranam/.espressif/tools/openocd-esp32/v0.10.0-esp32-20210401/openocd-esp32/share/openocd/scripts/board/esp-wroom-32.cfg
sbranam@NA-H17LM53:~/esp/esp-idf\$ which xtensa-esp32-elf-gdb
/home/sbranam/.espressif/tools/xtensa-esp32-elf/esp-2021r1-8.4.0/xtensa-esp32-elf/bin/xtensa-esp32-elf-gdb
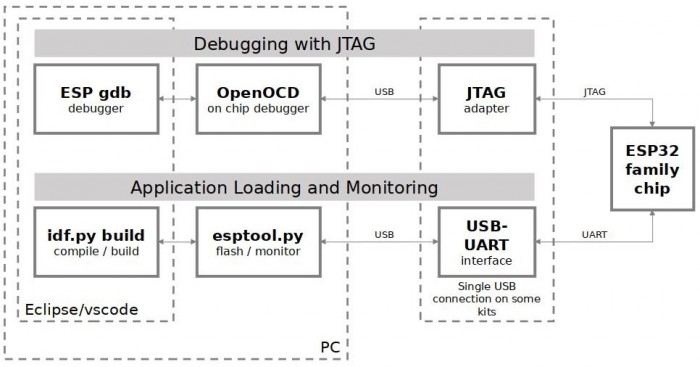
The ESP-IDF idf.py tool includes commands to run OpenOCD, and to run GDB with an ELF image to be debugged, connecting to OpenOCD automatically (diagram from ESP-IDF API Guides: JTAG Debugging):
Debugger Connection
Reference: Debugging the ESP32-C3 Device with JTAG
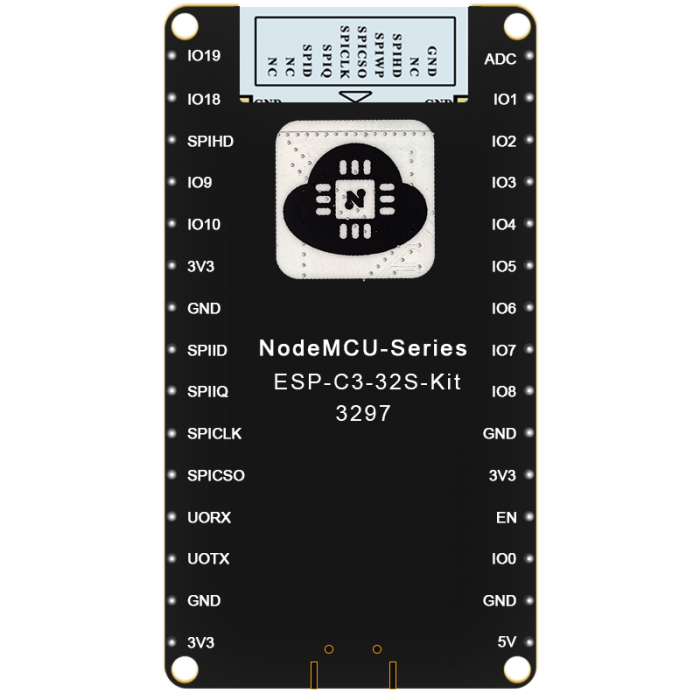
The board brings the USB-to-JTAG connection out to the breakout headers. Connect a USB cable with female connectors to the following pins:
The device does not report a name:
sbranam@NA-H17LM53:~\$ lsusb
...
Bus 001 Device 042: ID 303a:1001
...
OpenOCD
Reference: idf.py debug targets
See OpenOCD General-Commands for command reference. You must be connected to OpenOCD via TCL (localhost port 6666), telnet (localhost port 4444), or GDB (localhost port 3333) to issue commands. Note that most direct OpenOCD commands are not needed when using the ESP-IDF idf.py tool.
Note that a hardware reset that occurs while OpenOCD is running causes it to error out.
In a separate terminal, start a sudo shell to allow access to the debugger connection. Setup the ESP-IDF environment variables, then start the OpenOCD server with the board/esp32c3-builtin.cfg configuration file:
cd ~/esp/esp-idf
sudo bash
. ./export.sh
OPENOCD_COMMANDS="-f board/esp32c3-builtin.cfg" idf.py openocd
The idf.py command is equivalent to the following manual command:
openocd -f board/esp32c3-builtin.cfg
Example (this also shows GDB connecting, resetting and halting the device, and disconnecting):
sbranam@NA-H17LM53:~/esp/esp-idf\$ sudo bash
root@NA-H17LM53:~/esp/esp-idf#
root@NA-H17LM53:~/esp/esp-idf# . ./export.sh
Setting IDF_PATH to '/home/sbranam/esp/esp-idf'
Detecting the Python interpreter
Checking "python" ...
Checking "python3" ...
Python 3.6.9
"python3" has been detected
Adding ESP-IDF tools to PATH...
Not using an unsupported version of tool openocd-esp32 found in PATH: 0.10.0.
Using Python interpreter in /home/sbranam/.espressif/python_env/idf4.4_py3.6_env/bin/python
Checking if Python packages are up to date...
Python requirements from /home/sbranam/esp/esp-idf/requirements.txt are satisfied.
Added the following directories to PATH:
/home/sbranam/esp/esp-idf/components/esptool_py/esptool
/home/sbranam/esp/esp-idf/components/espcoredump
/home/sbranam/esp/esp-idf/components/partition_table
/home/sbranam/esp/esp-idf/components/app_update
/home/sbranam/.espressif/tools/xtensa-esp32-elf/esp-2021r1-8.4.0/xtensa-esp32-elf/bin
/home/sbranam/.espressif/tools/xtensa-esp32s2-elf/esp-2021r1-8.4.0/xtensa-esp32s2-elf/bin
/home/sbranam/.espressif/tools/xtensa-esp32s3-elf/esp-2021r1-8.4.0/xtensa-esp32s3-elf/bin
/home/sbranam/.espressif/tools/riscv32-esp-elf/esp-2021r1-8.4.0/riscv32-esp-elf/bin
/home/sbranam/.espressif/tools/esp32ulp-elf/2.28.51-esp-20191205/esp32ulp-elf-binutils/bin
/home/sbranam/.espressif/tools/esp32s2ulp-elf/2.28.51-esp-20191205/esp32s2ulp-elf-binutils/bin
/home/sbranam/.espressif/tools/openocd-esp32/v0.10.0-esp32-20210401/openocd-esp32/bin
/home/sbranam/.espressif/python_env/idf4.4_py3.6_env/bin
/home/sbranam/esp/esp-idf/tools
Done! You can now compile ESP-IDF projects.
Go to the project directory and run:
idf.py build
root@NA-H17LM53:~/esp/esp-idf# # OPENOCD_COMMANDS="-f board/esp32c3-builtin.cfg" idf.py openocd
Executing action: openocd
OpenOCD started as a background task 32231
Executing action: post_debug
Open On-Chip Debugger v0.10.0-esp32-20210401 (2021-04-01-15:45)
Licensed under GNU GPL v2
For bug reports, read
http://openocd.org/doc/doxygen/bugs.html
Info : only one transport option; autoselect 'jtag'
Warn : Transport "jtag" was already selected
force hard breakpoints
Info : Listening on port 6666 for tcl connections
Info : Listening on port 4444 for telnet connections
Info : esp_usb_jtag: Device found. Base speed 40000KHz, div range 1 to 255
Info : clock speed 40000 kHz
Info : JTAG tap: esp32c3.cpu tap/device found: 0x00005c25 (mfg: 0x612 (Espressif Systems), part: 0x0005, ver: 0x0)
Info : datacount=2 progbufsize=16
Info : Examined RISC-V core; found 1 harts
Info : hart 0: XLEN=32, misa=0x40101104
Info : [0] Found 8 triggers
Info : Listening on port 3333 for gdb connections
Info : accepting 'gdb' connection on tcp/3333
Warn : No symbols for FreeRTOS!
Info : JTAG tap: esp32c3.cpu tap/device found: 0x00005c25 (mfg: 0x612 (Espressif Systems), part: 0x0005, ver: 0x0)
Info : dropped 'gdb' connection
GDB
See Debugging with GDB for full GDB command reference. You can run OpenOCD commands in GDB by prefixing the command with the keyword "monitor" (abbreviated as "mon").
These examples show where I was testing the ESP-IDF NimBLE stack examples for peripheral and central devices, including customizations I made to test Secure Connection (SC) pairing with out of band (OOB) device association (see this blog series for information on pairing methods; register for and download this excellent free BLE Security Study Guide).
In the terminal where the application has been built and flashed to the device, run GDB:
idf.py gdb
This runs the cross-tool version of GDB, xtensa-esp32-elf-gdb, with the automatically-generated build/gdbinit file. The file sets the ELF file, connects to OpenOCD, resets and halts the device, sets a temporary hardware assisted breakpoint at app_main(), and continues to that point:
file /home/sbranam/esp/sbranam-nimble/blecent/build/blecent.elf
target remote :3333
mon reset halt
flushregs
thb app_main
c
Example (this also shows that the source is more recent than the executing code, so may be out of synch):
sbranam@NA-H17LM53:~/esp/sbranam-nimble/blecent\$ idf.py gdb
Executing action: gdb
GNU gdb (crosstool-NG esp-2021r1) 9.2.90.20200913-git
Copyright (C) 2020 Free Software Foundation, Inc.
License GPLv3+: GNU GPL version 3 or later
This is free software: you are free to change and redistribute it.
There is NO WARRANTY, to the extent permitted by law.
Type "show copying" and "show warranty" for details.
This GDB was configured as "--host=x86_64-build_pc-linux-gnu --target=riscv32-esp-elf".
Type "show configuration" for configuration details.
For bug reporting instructions, please see:
.
Find the GDB manual and other documentation resources online at:
.
For help, type "help".
Type "apropos word" to search for commands related to "word".
app_main () at ../main/main.c:741
warning: Source file is more recent than executable.
741 {
JTAG tap: esp32c3.cpu tap/device found: 0x00005c25 (mfg: 0x612 (Espressif Systems), part: 0x0005, ver: 0x0)
Hardware assisted breakpoint 1 at 0x4200672a: file ../main/main.c, line 741.
Thread 2 hit Temporary breakpoint 1, app_main () at ../main/main.c:741
741 {
(gdb)
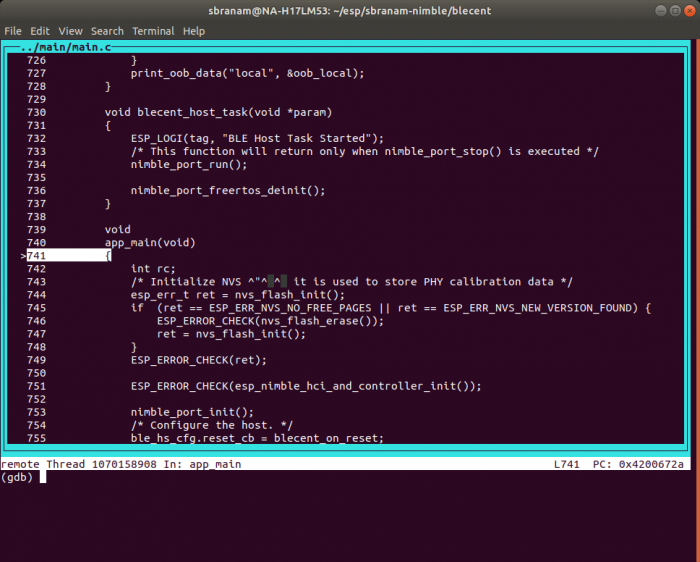
You can switch back and forth between CLI (command line interface) and TUI (text user interface) mode using Ctrl-x a. Example TUI, at the above breakpoint at app_main():
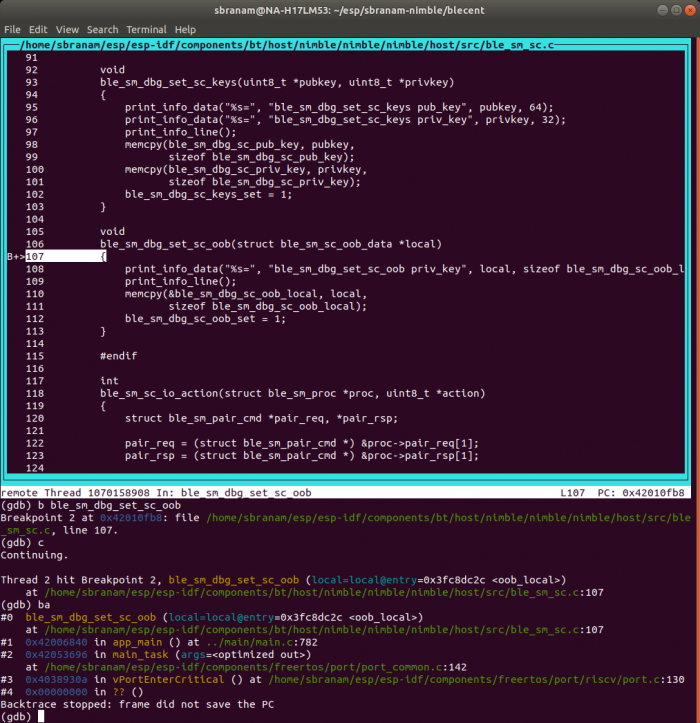
You can use most normal GDB commands. For example set a breakpoint and continue to it, showing source and backtrace (in this case, at a debug function ble_sm_dbg_set_sc_oob() I added):
You can get info for all threads, and backtrace for all threads:
(gdb) i threads
Id Target Id Frame
1 Thread 1070160792 (Name: IDLE) prvIdleTask (pvParameters=0x0)
at /home/sbranam/esp/esp-idf/components/freertos/tasks.c:3764
* 2 Thread 1070158908 (Name: main) ble_sm_dbg_set_sc_oob (local=local@entry=0x3fc8dc2c )
at /home/sbranam/esp/esp-idf/components/bt/host/nimble/nimble/nimble/host/src/ble_sm_sc.c:107
3 Thread 1070190708 (Name: btController) 0x40383d48 in esp_crosscore_int_send_yield (
core_id=core_id@entry=0) at /home/sbranam/esp/esp-idf/components/esp_system/crosscore_int.c:144
4 Thread 1070163188 (Name: Tmr Svc) 0x40383d48 in esp_crosscore_int_send_yield (
core_id=core_id@entry=0) at /home/sbranam/esp/esp-idf/components/esp_system/crosscore_int.c:144
5 Thread 1070154224 (Name: esp_timer) 0x40389294 in vPortClearInterruptMask (mask=1)
at /home/sbranam/esp/esp-idf/components/freertos/port/riscv/port.c:199
(gdb) thread apply all ba
Thread 5 (Thread 1070154224):
#0 0x40389294 in vPortClearInterruptMask (mask=1) at /home/sbranam/esp/esp-idf/components/freertos/port/riscv/port.c:199
#1 0x403892be in vPortExitCritical () at /home/sbranam/esp/esp-idf/components/freertos/port/riscv/port.c:139
#2 0x00000000 in ?? ()
Backtrace stopped: frame did not save the PC
Thread 4 (Thread 1070163188):
#0 0x40383d48 in esp_crosscore_int_send_yield (core_id=core_id@entry=0) at /home/sbranam/esp/esp-idf/components/esp_system/crosscore_int.c:144
#1 0x40389416 in vPortYield () at /home/sbranam/esp/esp-idf/components/freertos/port/riscv/port.c:360
#2 0x00000000 in ?? ()
Backtrace stopped: frame did not save the PC
Thread 3 (Thread 1070190708):
#0 0x40383d48 in esp_crosscore_int_send_yield (core_id=core_id@entry=0) at /home/sbranam/esp/esp-idf/components/esp_system/crosscore_int.c:144
#1 0x40389416 in vPortYield () at /home/sbranam/esp/esp-idf/components/freertos/port/riscv/port.c:360
#2 0x00000000 in ?? ()
Backtrace stopped: frame did not save the PC
Thread 2 (Thread 1070158908):
#0 ble_sm_dbg_set_sc_oob (local=local@entry=0x3fc8dc2c ) at /home/sbranam/esp/esp-idf/components/bt/host/nimble/nimble/nimble/host/src/ble_sm_sc.c:107
#1 0x42006840 in app_main () at ../main/main.c:782
#2 0x42053696 in main_task (args=) at /home/sbranam/esp/esp-idf/components/freertos/port/port_common.c:142
#3 0x4038930a in vPortEnterCritical () at /home/sbranam/esp/esp-idf/components/freertos/port/riscv/port.c:130
#4 0x00000000 in ?? ()
Backtrace stopped: frame did not save the PC
Thread 1 (Thread 1070160792):
#0 prvIdleTask (pvParameters=0x0) at /home/sbranam/esp/esp-idf/components/freertos/tasks.c:3764
#1 0x4038930a in vPortEnterCritical () at /home/sbranam/esp/esp-idf/components/freertos/port/riscv/port.c:130
#2 0x00000000 in ?? ()
Backtrace stopped: frame did not save the PC
(gdb)
Managing Breakpoints
Pausing a multi-threaded embedded device at software breakpoints to examine data and step through instructions can be problematic, because timers may continue running and expire, and other interrupts may occur. This may result in unexpected execution when you continue, as the device vectors off to other code.
Anything leading up to a software breakpoint that occurs after soft reset can be trusted, so examining backtraces and existing data at that point is similar to examining a coredump. However, continuing from that point may not be reliable.
There are two useful strategies for making progress when using breakpoints:
- If using a software breakpoint (the GDB "b" and "tb" commands), clear the breakpoint if it wasn't temporary, set a new one further along the execution path, and soft reset the device with the "mon reset halt" command. This allows you to gather incremental information one reset at a time.
- Use hardware breakpoints (the GDB "hb" and "thb" commands). These should hold all activity within the processor so that it can continue safely. However, external activity may still cause unexpected results.
Simultaneous Monitoring And Debugging
You can monitor the device via the Micro USB connection and debug it via the USB-to-JTAG connection at the same time, with both cables connected. However, because starting the monitor causes a hardware reset that would cause OpenOCD to error out, you need to do operations in a specific order:
- Start the monitor with the idf.py -p monitor command. This will reset the device and begin executing.
- Start OpenOCD with the OPENOCD_COMMANDS="-f board/esp32c3-builtin.cfg" idf.py openocd command.
- Start GDB with the idf.py gdb command. This will soft reset the device and break at app_main(). The monitor output will show partial normal startup activity.
Once you continue execution from this point, if you need to reset the device, use the GDB mon reset halt command. This maintains all OpenOCD, GDB, and monitor operation so you can continue debugging without having to restart everything.
Debugging Strategy
In general, a mix of GDB breakpoints and prints that are reported on the monitor terminal form an effective strategy for debugging and testing. Stopping at breakpoints allows you to dig around in the internals of the code, while prints allow you to log real-time activity without significantly disrupting it.
Excessive logging can interfere with the timing characteristics of real-time code. Just as it's useful to reset after halting at a breakpoint and collecting information, it may be necessary to change the logging and rebuild after collecting information in a test run. Then each successive run allows you to log and collect incremental information, one step at a time.
Eventually you have enough information to strip the logging back down to a minimum and allow the code to run without breakpoints.
Wireshark Sniffing
This section assumes you've downloaded and setup the Nordic sniffer package and User Manual, and the nRF Connect For Mobile application.
In a terminal, run Wireshark via sudo to allow access to the serial port containing the dongle:
sudo wireshark
Follow the instructions in User Manual chapter 3 "Running nRF Sniffer" and 4 "nRF Sniffer usage" to run the sniffer in Wireshark.'
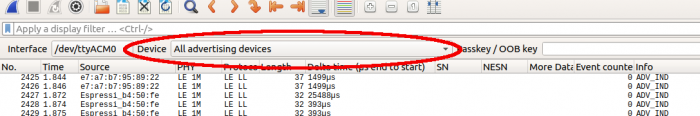
The sniffer works in two modes:
Default is to listen on all advertising channels, when "Device" is set to "All advertising devices". This only captures advertising-related packets, for all devices:
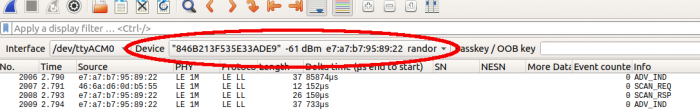
Or follow a specific device by selecting it from the the "Device" list. This captures both advertising-related and connection-related packets involving that device:
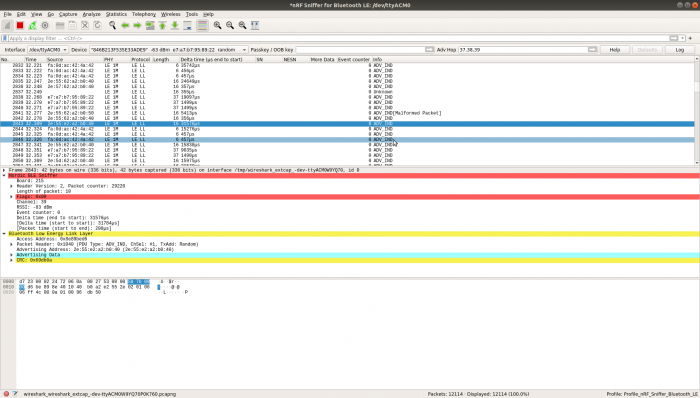
This is an example capture:
Filtering On Known Data
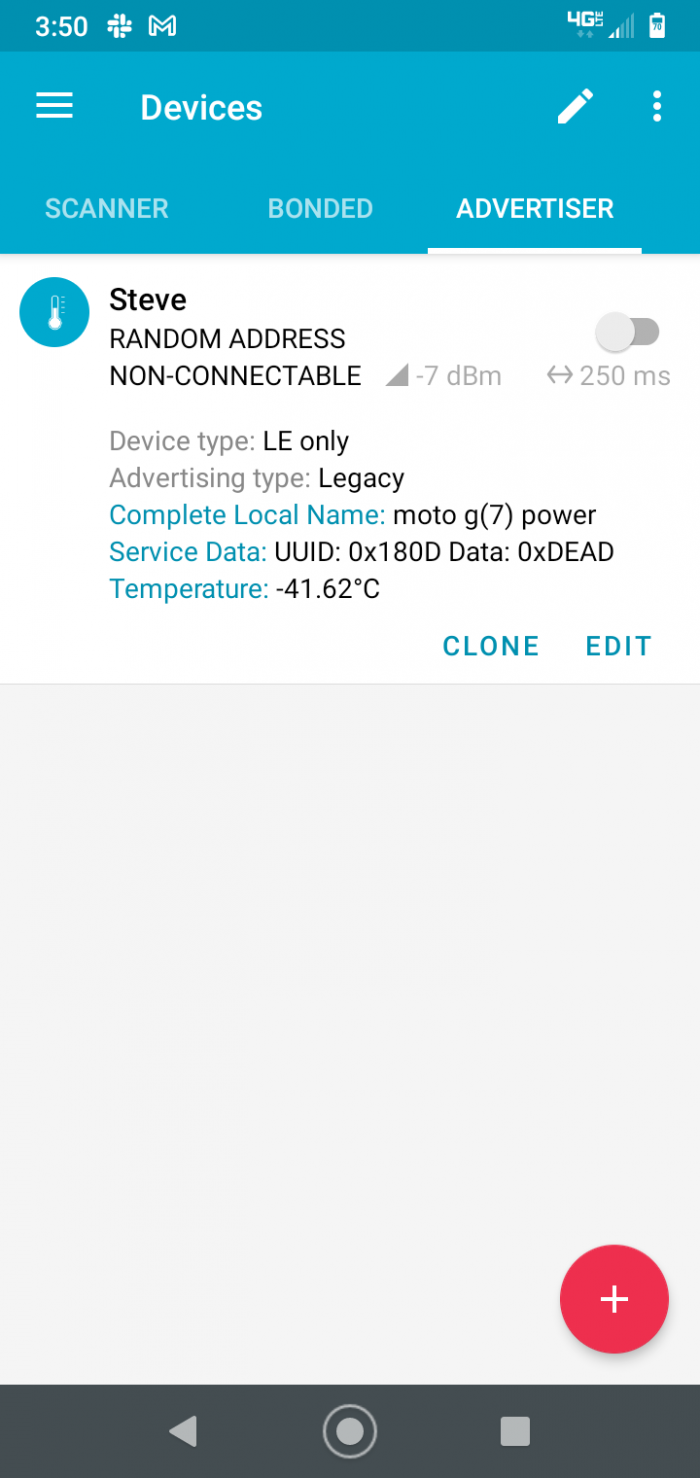
Capturing BLE data in "All advertising devices" mode is noisy if you have multiple devices in range. A simple way to isolate an advertiser you control is to configure it to send known data, then filter for that data in Wireshark.
In this example, the Nordic "nRF Connect for Mobile" app on a smartphone has been configured to advertise Service Data in the "Heart Rate" and "Health Thermometer" services: heart rate 0xDEAD and temperature 0xBEEF.
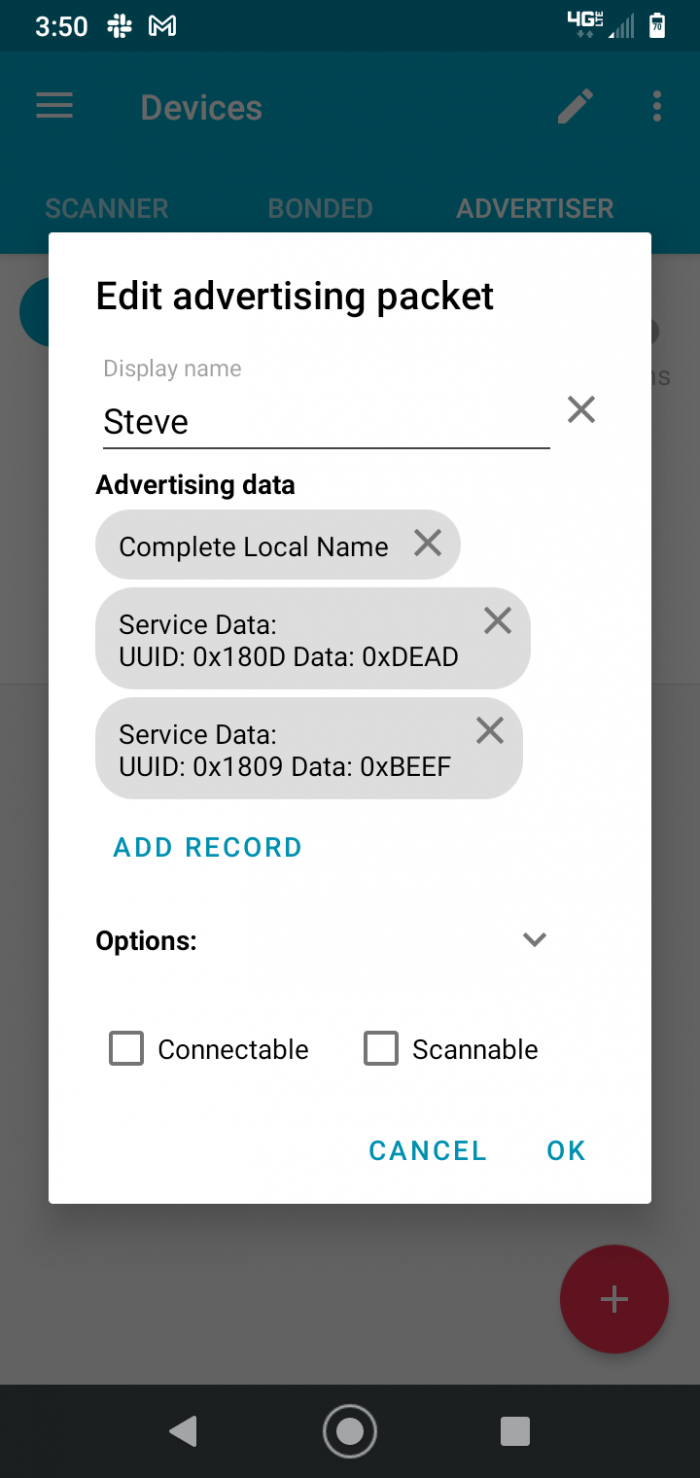
Enter the following In the Wireshark display filter box:
btcommon.eir_ad.entry.service_data == de:ad
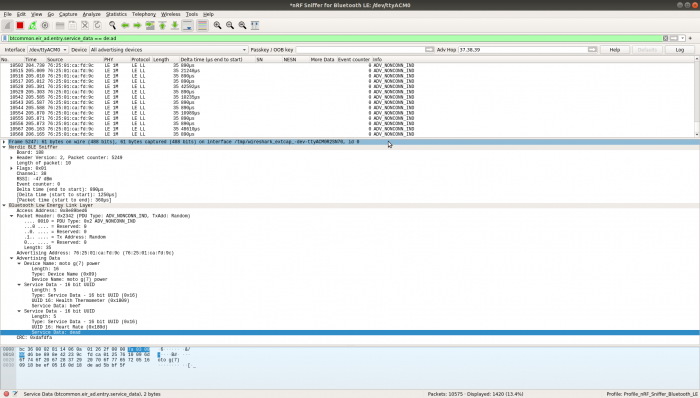
You can use this to view other fields, such as the source address (Advertising Address), matched up with the known data:
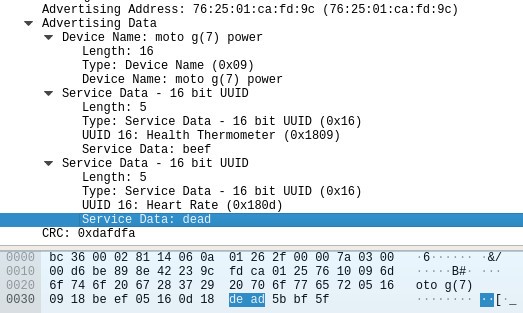
You can also create a display filter for a specific value automatically by right-clicking on the value in the packet decode. Click on "Apply as Filter" in the popup menu, then click on "Selected" in the submenu. This is an easy way to get the right field name and syntax for the filter.
Once you've identified a particular device of interest, select that device in the "Device" list.
Creating Filters From Captured Data
Wireshark filters can be difficult to form if you don't know the field names or syntax. You can create them from actual captured data. This greatly simplifies using filters, since it shows the field name and value syntax. Then you can modify the filter to look for other things; editing the field name will bring up a pop-up list of fields you can select from. The filter will also be recorded in the Wireshark filter history drop-down list, and you can copy and paste it to save it.
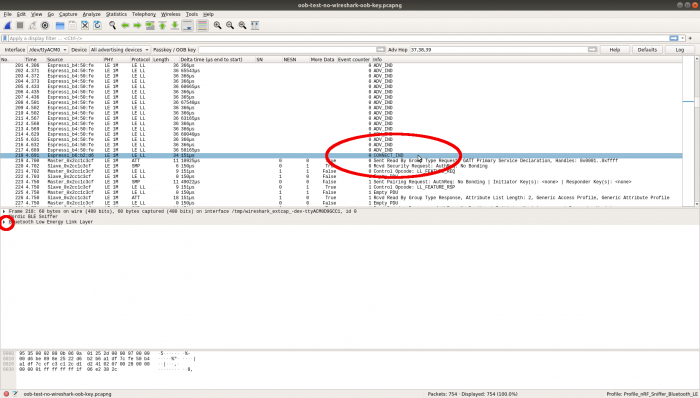
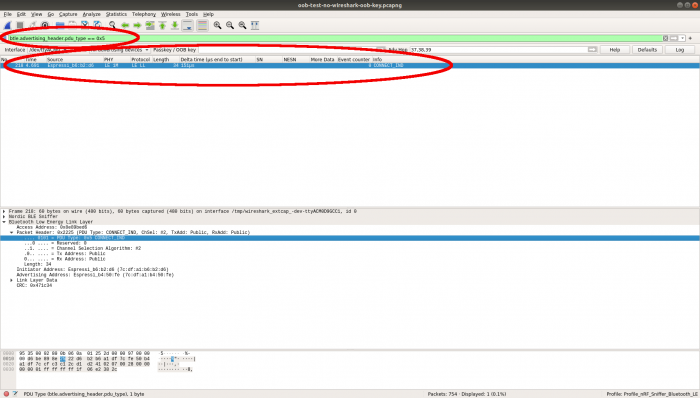
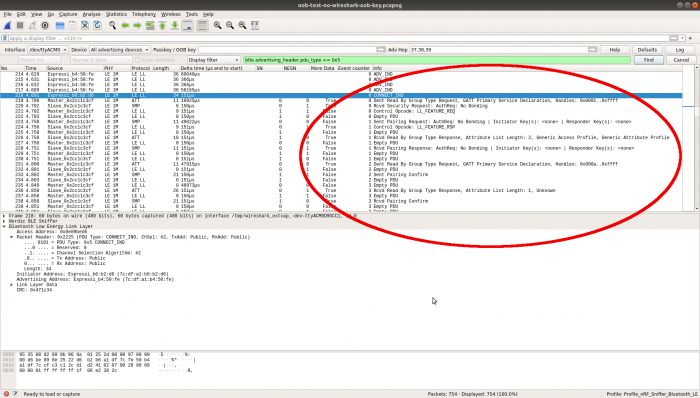
This example shows how to create a filter to display only connection indication packets, using an existing capture file.
Open the file in Wireshark. It will contain a number of advertising packets, and all items in the middle frame decode pane will be collapsed down:
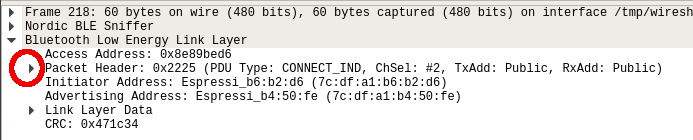
Scroll down the upper packet summary pane to find the CONNECT_IND packet and click on it. This is the first non-advertisement in this capture. Click on the expansion triangle next to "Bluetooth Low Energy Link Layer" in the middle pane to expand that layer:
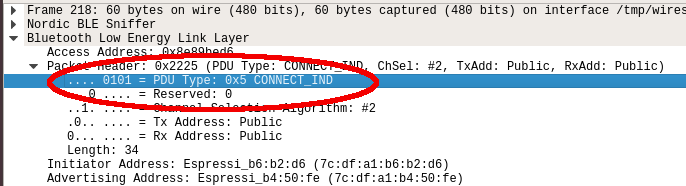
In the expansion, click on the expansion triangle next to "Packet Header" to expand that next layer:
Click on the expanded line showing PDU Type:
Right-click on the line to bring up the pop-up menu. Go to "Apply as Filter", then click on "Selected":
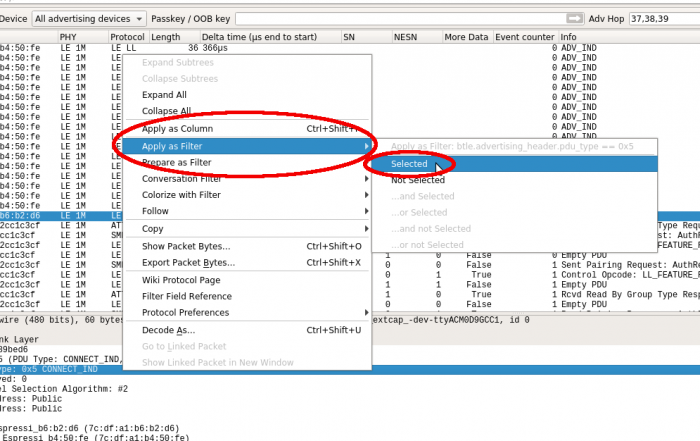
This will add the filter to the display filter box, and filter the packet summary pane to just the packets matching the selection criteria:
Using A Filter To Find Packets
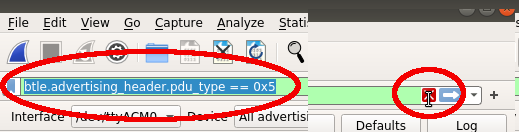
You can find packets using the filter syntax. If you have a filter set in the display filter box (for instance, created from an actual packet as shown above), you can copy the filter for use in the find box.
Select the filter text in the display filter box and copy it. Click the X button on the right end of the box to clear the filter:
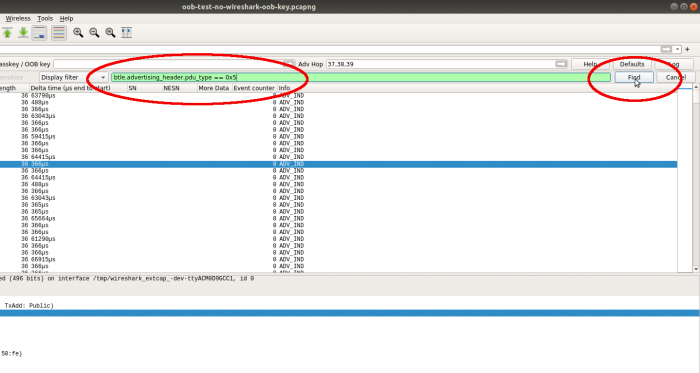
Scroll the upper pane up to some random packet so that you can see when the find command actually finds a packet. Hit Ctrl+F to bring up the find box, then paste the copied filter text into it and click the "Find" button:
The CONNECT_IND packet will now be selected:
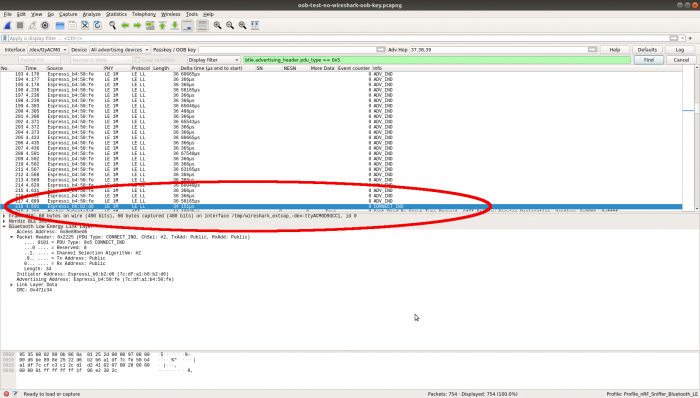
Scroll down to see the interesting packets that show activity on the connection:
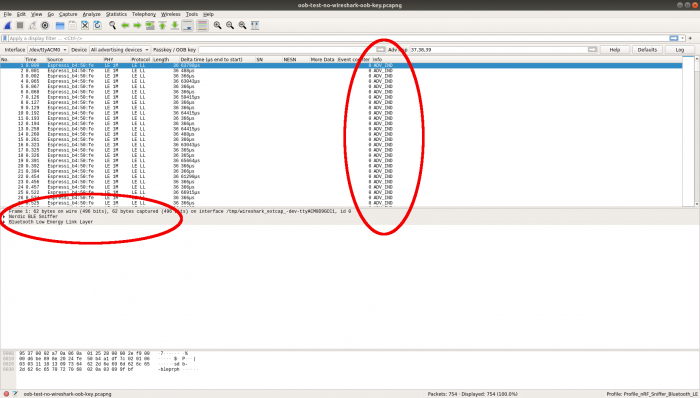
Note that all of the above shows unsecured connections. Once encryption has been enabled on a connection, Wireshark will be unable to decrypt the packets. It will report "Encrypted packet decrypted incorrectly (bad MIC)" on each packet.
For Legacy pairing with OOB association, you can enter the OOB key in the Wireshark "Passkey / OOB Key" text box to decrypt traffic, but for Secure Connection pairing with OOB association, there is no way to enter the required information.
You might also like... (promoted content)


