


Introduction to Deep Insight Analysis for RTOS Based Applications
Over the past several years, embedded systems have become extremely complex. As systems become more complex, they become harder and more time consuming to debug. It isn’t uncommon for development teams to spend more than 40% development cycle time just debugging their systems. This is where deep insight analysis has the potential to dramatically decrease costs and time to market.
Defining Deep Insight Analysis
Deep insight analysis is a set of tools and techniques that can be applied to an RTOS based application to debug and verify the application. Typically, developers will create their RTOS based application and use basic debugging techniques such as break-points and assertions to debug them. While these techniques are useful, they don’t help developers go deep enough. Deep insight analysis includes:
- RTOS aware debugging
- Run-time analysis
- Profiling and coverage analysis
These three pillars help developers dig deeper in their applications and see what is really happening rather than having to simply guess and use trial-by-error debugging.
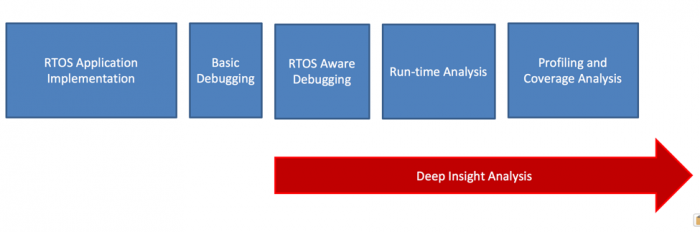
Figure 1 – Defining Deep Insight Analysis
RTOS Aware Debugging
The first deep insight analysis technique available to developers is the use of RTOS aware debugging. RTOS aware debugging exposes the internal OS structures and data during a debugging session. The data is available through the IDE during a debugging session and in various locations depending on the IDE that is used.
A classic example where RTOS aware debugging is useful is to review a tasks stack usage. I see developers all the time who see a strange behavior in their system, such as a system crash, and then decide that maybe it’s the stack and just randomly increase the stack size in the hope that it fixes the problem. Rather than guessing, RTOS Aware debugging can be used to see how much stack space is used for each task and provide a developer with real data they can used to analyze their system. The data goes well beyond just the stack space as well and includes:
- Task name
- State
- Stack information
- Event status
- Etc
An example can be seen in Figure 2.
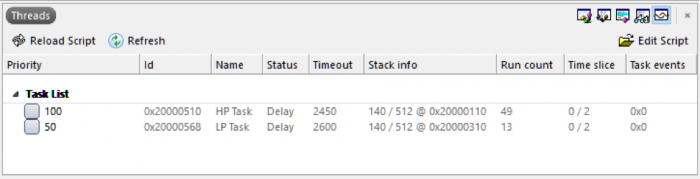
Figure 2 – RTOS OS Aware Interface from SEGGER Embedded Studio
Run-time Analysis
OS aware debugging provides a developer with a good baseline for what’s happening with a software’s OS, but it doesn’t provide any detail about how a developer’s application is behaving. In order to get data on the application, developers need to use the second deep insight analysis technique which is run-time analysis.
Run-time analysis records events which occur in the system in order to reconstruct a visual representation that can be used by developers to debug and verify their application. To perform this analysis, developers need to have the hardware tools to perform real-time tracing which can be as simple as having a baseline debugger or a SEGGER J-Trace depending on the application under review.
Run-time analysis can provide developers with many insights. For example, a developer can visually look through the program execution and see common RTOS problems such as:
- Task starvation
- Priority inversions
- Deadlock
- Task jitter
Run-time analysis achieves this by recording and timestamping events such as:
- Task state changes
- Interrupt entry/exit
- Semaphore giving and taking
- Mutex locking and unlocking
- Message signaling and receiving
- RTOS scheduler status
These events are then reconstructed to provide a history and visualization that allows a developer to see what is actually happening on their target processor.
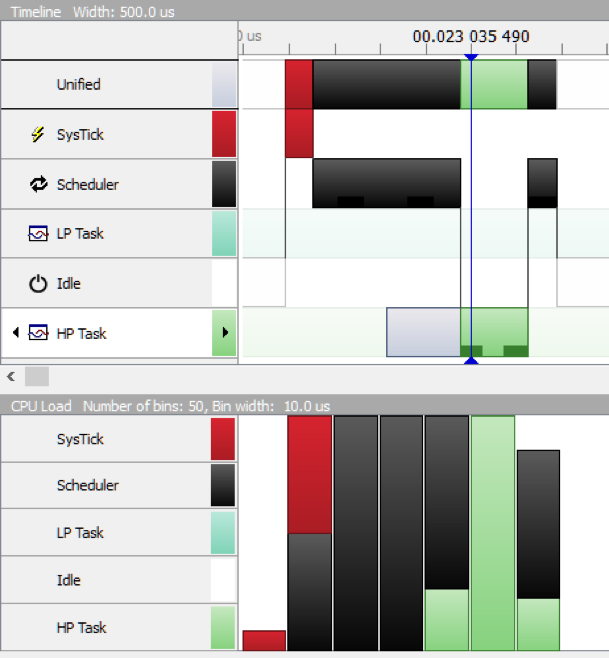
Figure 3 – SEGGER SystemView Analysis of an Application
Profiling and Coverage Analysis
The third technique available to developers using Deep Insight Analysis is the ability to profile and verify code coverage. Not everything is just about debugging but sometimes verifying that the application is correct and that the test cases hit every line of code. If a line of code doesn’t get executed during testing, it could have a bug in it.
Profiling and coverage analysis can’t be done using a basic debugger. A developer needs a debugger that can support ETM. This allows a developer to get not just very fast data from the embedded target but performs instruction tracing! Every instruction executed by the CPU is recorded and can be viewed by the developer. Now this sounds painful but what is really neat about this is that it can be correlated with the code that is executed to provide information on whether the line of code was executed or not.
There are a few different tracing tools available but one that I’ve used that is free to use with a J-Trace is SEGGERs Ozone software. The software is a stand-alone debugging environment that can perform the profiling analysis. Every time a line of code is executed the instructions appear in an instruction trace window while the source windows counts how many times that line has been executed since the application started executing. At a desired point of execution, a developer can pause and review the code profile data and the function analysis to see what the code and instruction coverage is, how much time is spent in different functions and get a better feel for how their application is running.
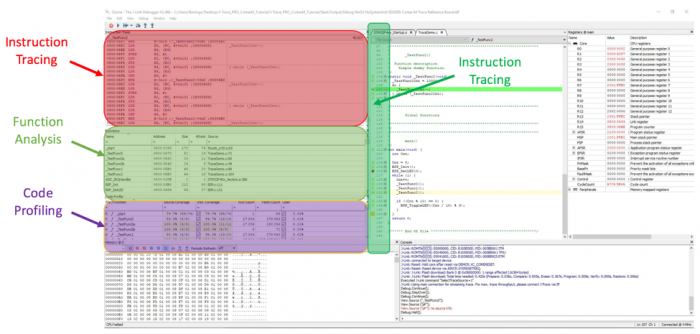
Figure 4 – Performing a Code Profile using SEGGER Ozone
In some industries, code profiling in this manner is required, while in others, it’s just a way to improve software robustness and minimize bugs. I would advocate that every developer should be using techniques like this simply from my own experience that to save ourselves pain, we need to use the right tools for the job.
Conclusions and Going Further
As we have seen, deep insight analysis is an interesting and cutting edge tool to help developers dig deeper into their software to not just debug but also verify its execution. We’ve only just scratched the surface on how these techniques can be applied to a target system. Developers who master these tools will quickly discover that they are able to decrease the time they spend debugging those hard to discover bugs that hide in every embedded system.
If you are interested in learning more about deep insight analysis and how it can be applied to your own development cycle, check-out my free webinar entitled “Verifying RTOS Applications using Deep Insight Analysis”.
Jacob Beningo is an embedded software consultant who currently works with clients in more than a dozen countries to dramatically transform their businesses by improving product quality, cost and time to market. He has published more than 200 articles on embedded software development techniques, is a sought-after speaker and technical trainer and holds three degrees which include a Masters of Engineering from the University of Michigan. Feel free to contact him at jacob@beningo.com, at his website www.beningo.com, and sign-up for his monthly Embedded Bytes Newsletter here.


- Comments
- Write a Comment Select to add a comment
you should add "rtos" tag to every article you write about rtos, including this one . thanks.
To post reply to a comment, click on the 'reply' button attached to each comment. To post a new comment (not a reply to a comment) check out the 'Write a Comment' tab at the top of the comments.
Please login (on the right) if you already have an account on this platform.
Otherwise, please use this form to register (free) an join one of the largest online community for Electrical/Embedded/DSP/FPGA/ML engineers:


